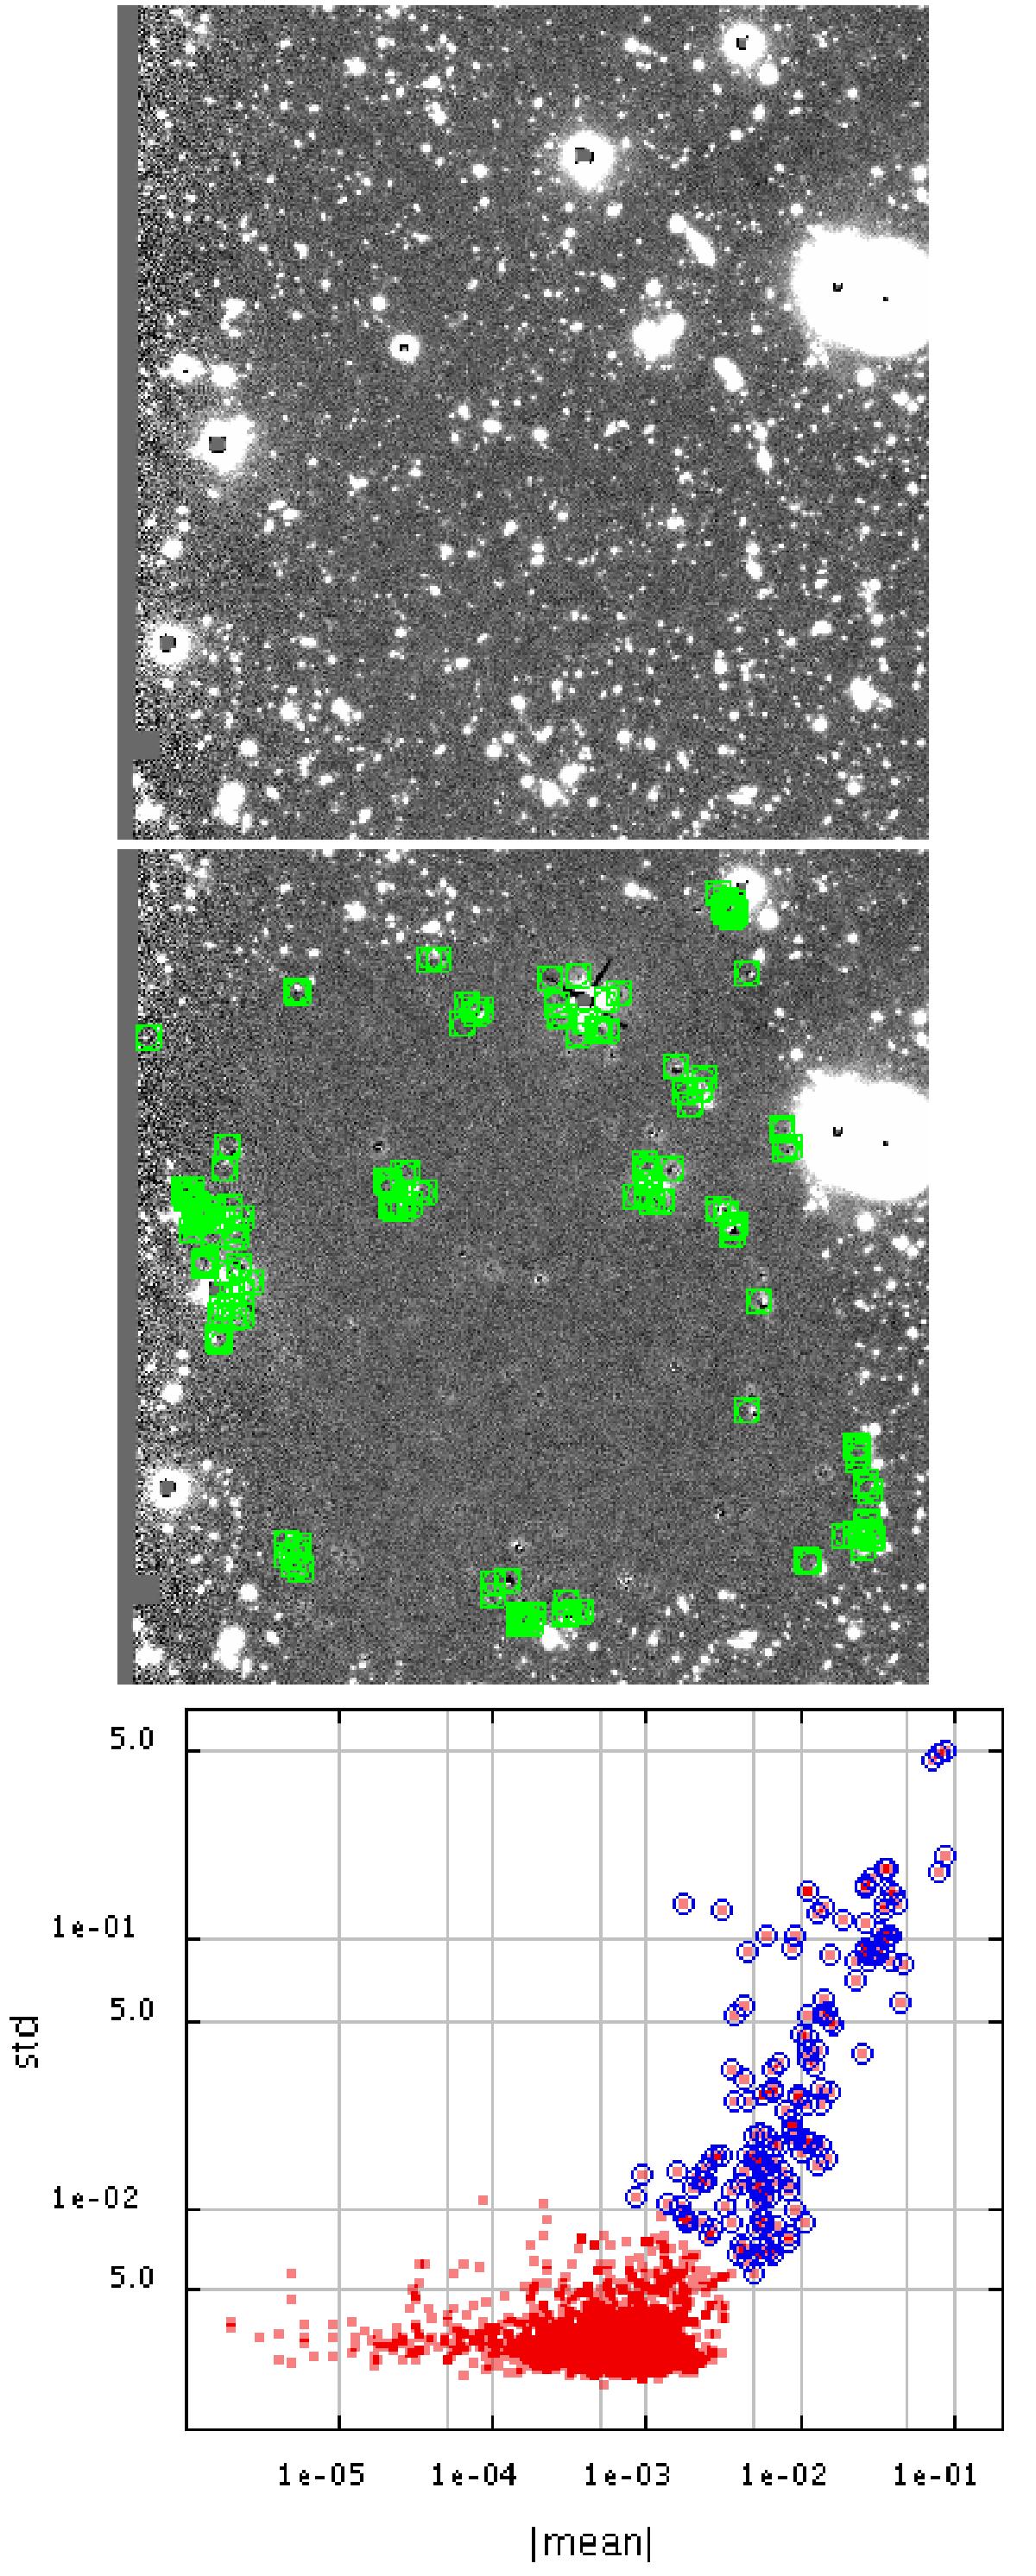
Fig. 8

Original LRI (upper) and residual after fitting (centre) on a FORS2 R-band image; the sources with green squares correspond to the ones selected by eye as deviating from the global distribution in the bottom plot (the blue open circles; red dots are the whole catalogue), where the standard deviation of the residual of each source has been plotted against the absolute value of the mean of the residual (both values have been taken from the output file from t-phot).
Current usage metrics show cumulative count of Article Views (full-text article views including HTML views, PDF and ePub downloads, according to the available data) and Abstracts Views on Vision4Press platform.
Data correspond to usage on the plateform after 2015. The current usage metrics is available 48-96 hours after online publication and is updated daily on week days.
Initial download of the metrics may take a while.


