Fig. 7
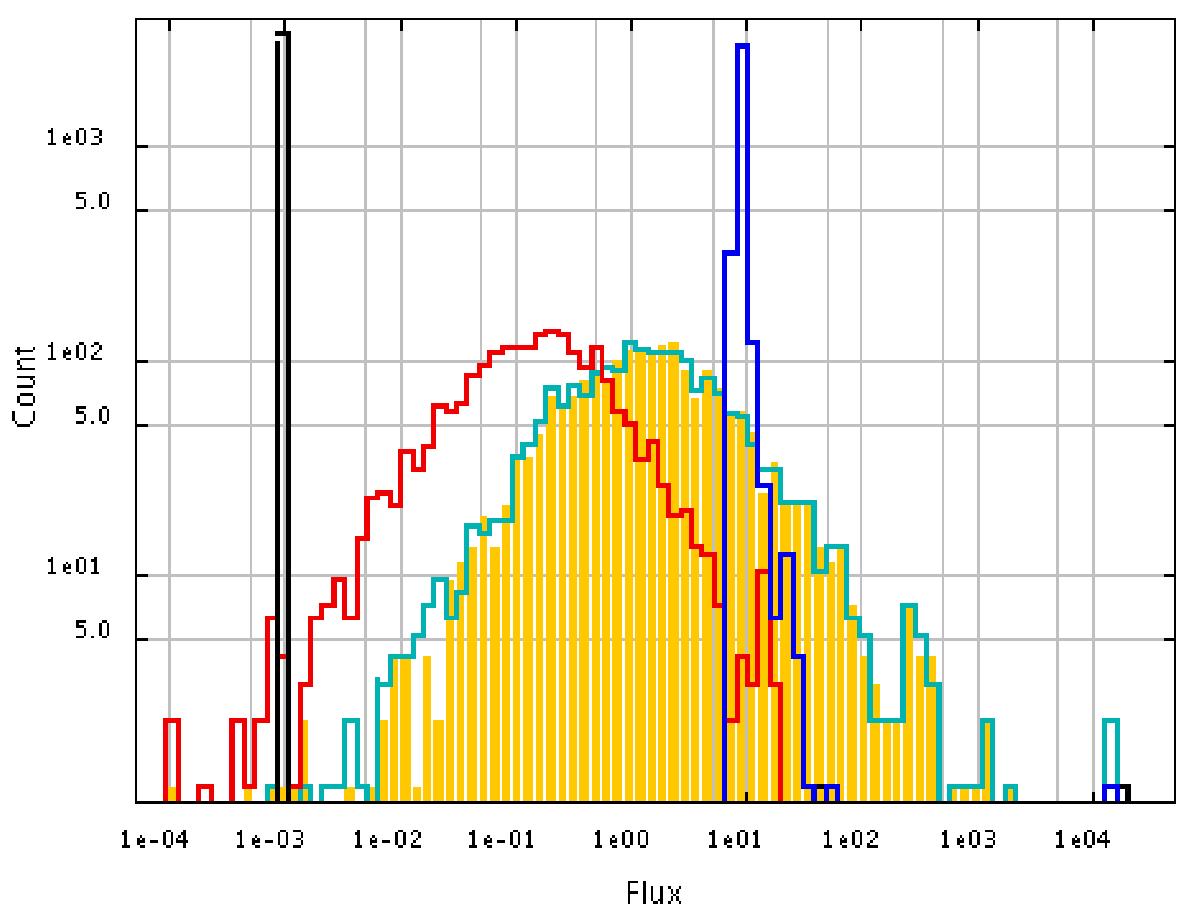
Results of a series of tests on a simulated image using the flux prioring method. Different histograms refer to separate runs on the same LRI. The yellow bars are the fluxes f measured without imposing any constraints (run A). In all the other runs, a given set of flux priors with a corresponding uncertainty has been given to all the sources, and the histograms show the measured fluxes: fconstr,B = f ± 0.5 (cyan), fconstr,C = 10 ± 0.1 (blue), fconstr,D = 10-3 ± 0.1 (red), fconstr,E = 10-3 ± 10-4 (black). We note that (i) the run without constraints (yellow) yields very similar results to the run where each source has its “true” input flux as prior (B, cyan); (ii) in the other runs the flux is forced to a fixed value which is retrieved consistently with the allowed uncertainties. See text for more details.
Current usage metrics show cumulative count of Article Views (full-text article views including HTML views, PDF and ePub downloads, according to the available data) and Abstracts Views on Vision4Press platform.
Data correspond to usage on the plateform after 2015. The current usage metrics is available 48-96 hours after online publication and is updated daily on week days.
Initial download of the metrics may take a while.