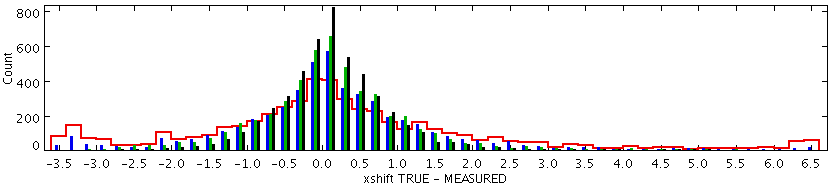
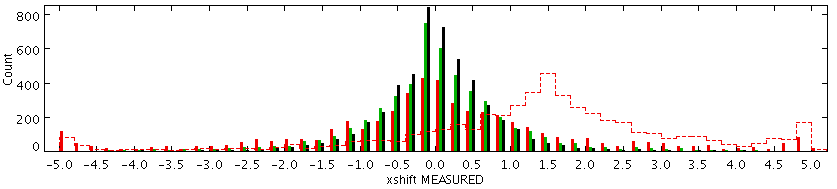
Fig. 5
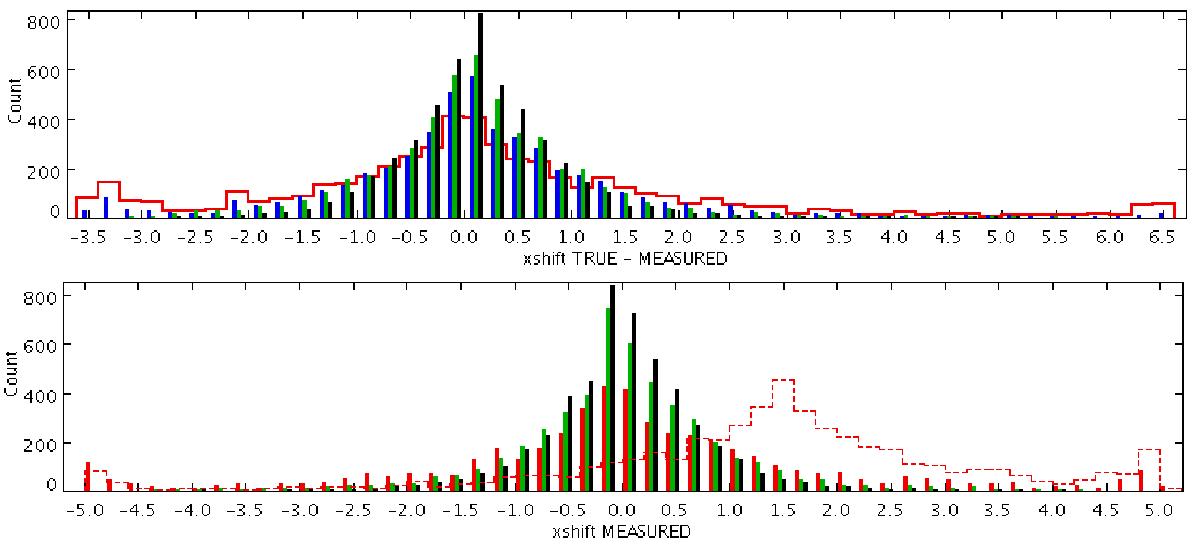
Individual registration of sources (dance). Top panel: histogram of the difference between true and measured shifts in the X direction in a simulated image; red: region-based dance (v1.5.11); blue bars: individual dance, without smoothing; green bars: individual dance with smoothing on a fixed Rneigh area; black bars: individual dance with smoothing on a fixed number Nneigh = 100 of neighbouring sources. Bottom panel: histogram of the measured shifts in the X direction in a simulated image where no shifts were applied; red bars: region-based dance (v1.5.11); green bars: individual dance with smoothing on a fixed Rneigh area; black bars: individual dance with smoothing on a fixed number Nneigh = 100 of neighbouring sources; dashed red: region-based dance on the image with shifts, for reference. See text for more details.
Current usage metrics show cumulative count of Article Views (full-text article views including HTML views, PDF and ePub downloads, according to the available data) and Abstracts Views on Vision4Press platform.
Data correspond to usage on the plateform after 2015. The current usage metrics is available 48-96 hours after online publication and is updated daily on week days.
Initial download of the metrics may take a while.