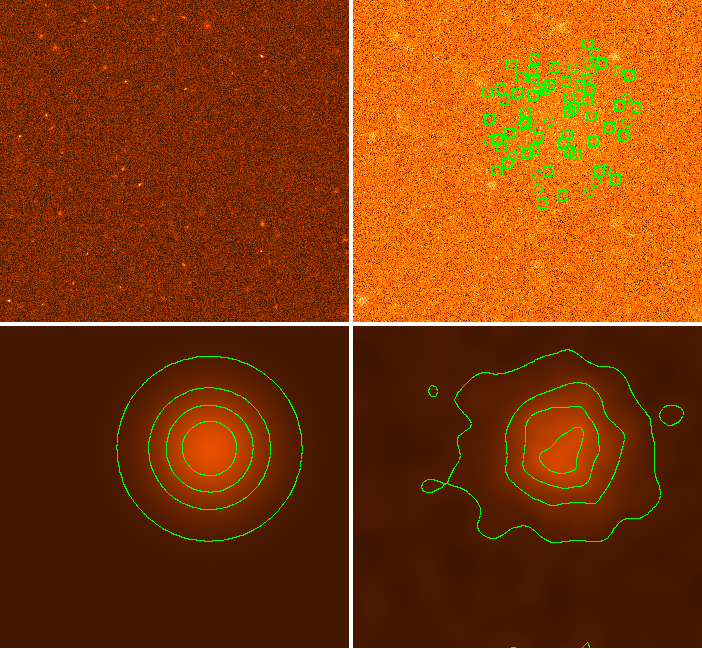
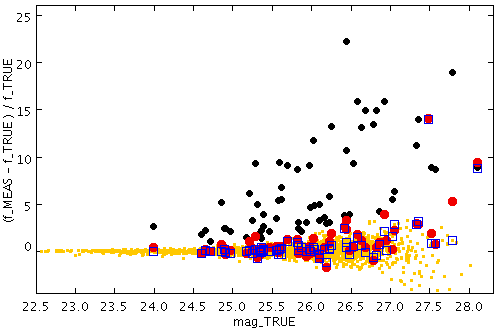
Fig. 2
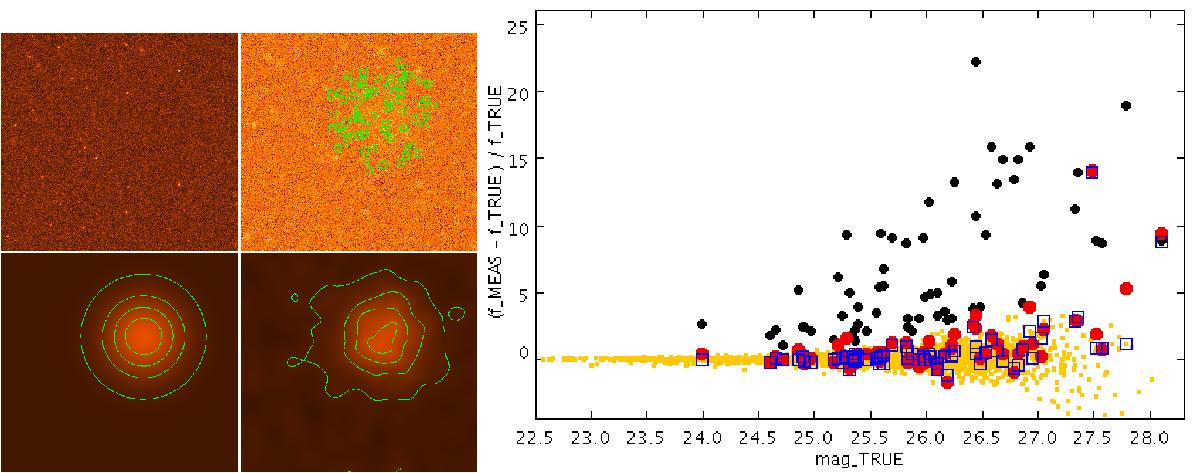
Left panels: simulated images to test the local background estimation techinque. Top left: HRI (FWHM = 0.2″); top right: LRI (FWHM = 1.66″; many sources are too faint to be seen); bottom left: artificially added background (on a different scale and with density contours to enhance visibility); bottom right: background estimated by t-phot, after smoothing with a Gaussian kernel. The plot on the right shows the relative error on the measured flux versus the input true magnitude: tiny yellow dots refer to the whole catalogue in a run with no background enhancement; in the run with the enhanced background but without applying the local background estimation method, many sources (black dots) have largely overestimated fluxes (their positions are shown with green marks in the LRI image, second sub-panel of the left image: they are all gathered where the artificial background is stronger). When applying the local background estimation method, the measured fluxes of these sources are much more reasonable (red dots), and close to their values measured in the run without background enhancement (empty blue squares).
Current usage metrics show cumulative count of Article Views (full-text article views including HTML views, PDF and ePub downloads, according to the available data) and Abstracts Views on Vision4Press platform.
Data correspond to usage on the plateform after 2015. The current usage metrics is available 48-96 hours after online publication and is updated daily on week days.
Initial download of the metrics may take a while.