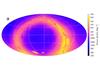
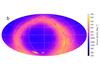
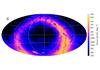
Fig. 8

Density of sources in the secondary data set of Gaia DR1: a) all 1141 million sources in the secondary data set; b) the 685 million sources in common with the IGSL; c) the 456 million new sources. These maps use an Aitoff projection in equatorial (ICRS) coordinates, with origin α = δ = 0 at the centre and α increasing from right to left. Mean densities are shown for sources in cells of about 0.84 deg2.
Current usage metrics show cumulative count of Article Views (full-text article views including HTML views, PDF and ePub downloads, according to the available data) and Abstracts Views on Vision4Press platform.
Data correspond to usage on the plateform after 2015. The current usage metrics is available 48-96 hours after online publication and is updated daily on week days.
Initial download of the metrics may take a while.