Free Access
Fig. A.2
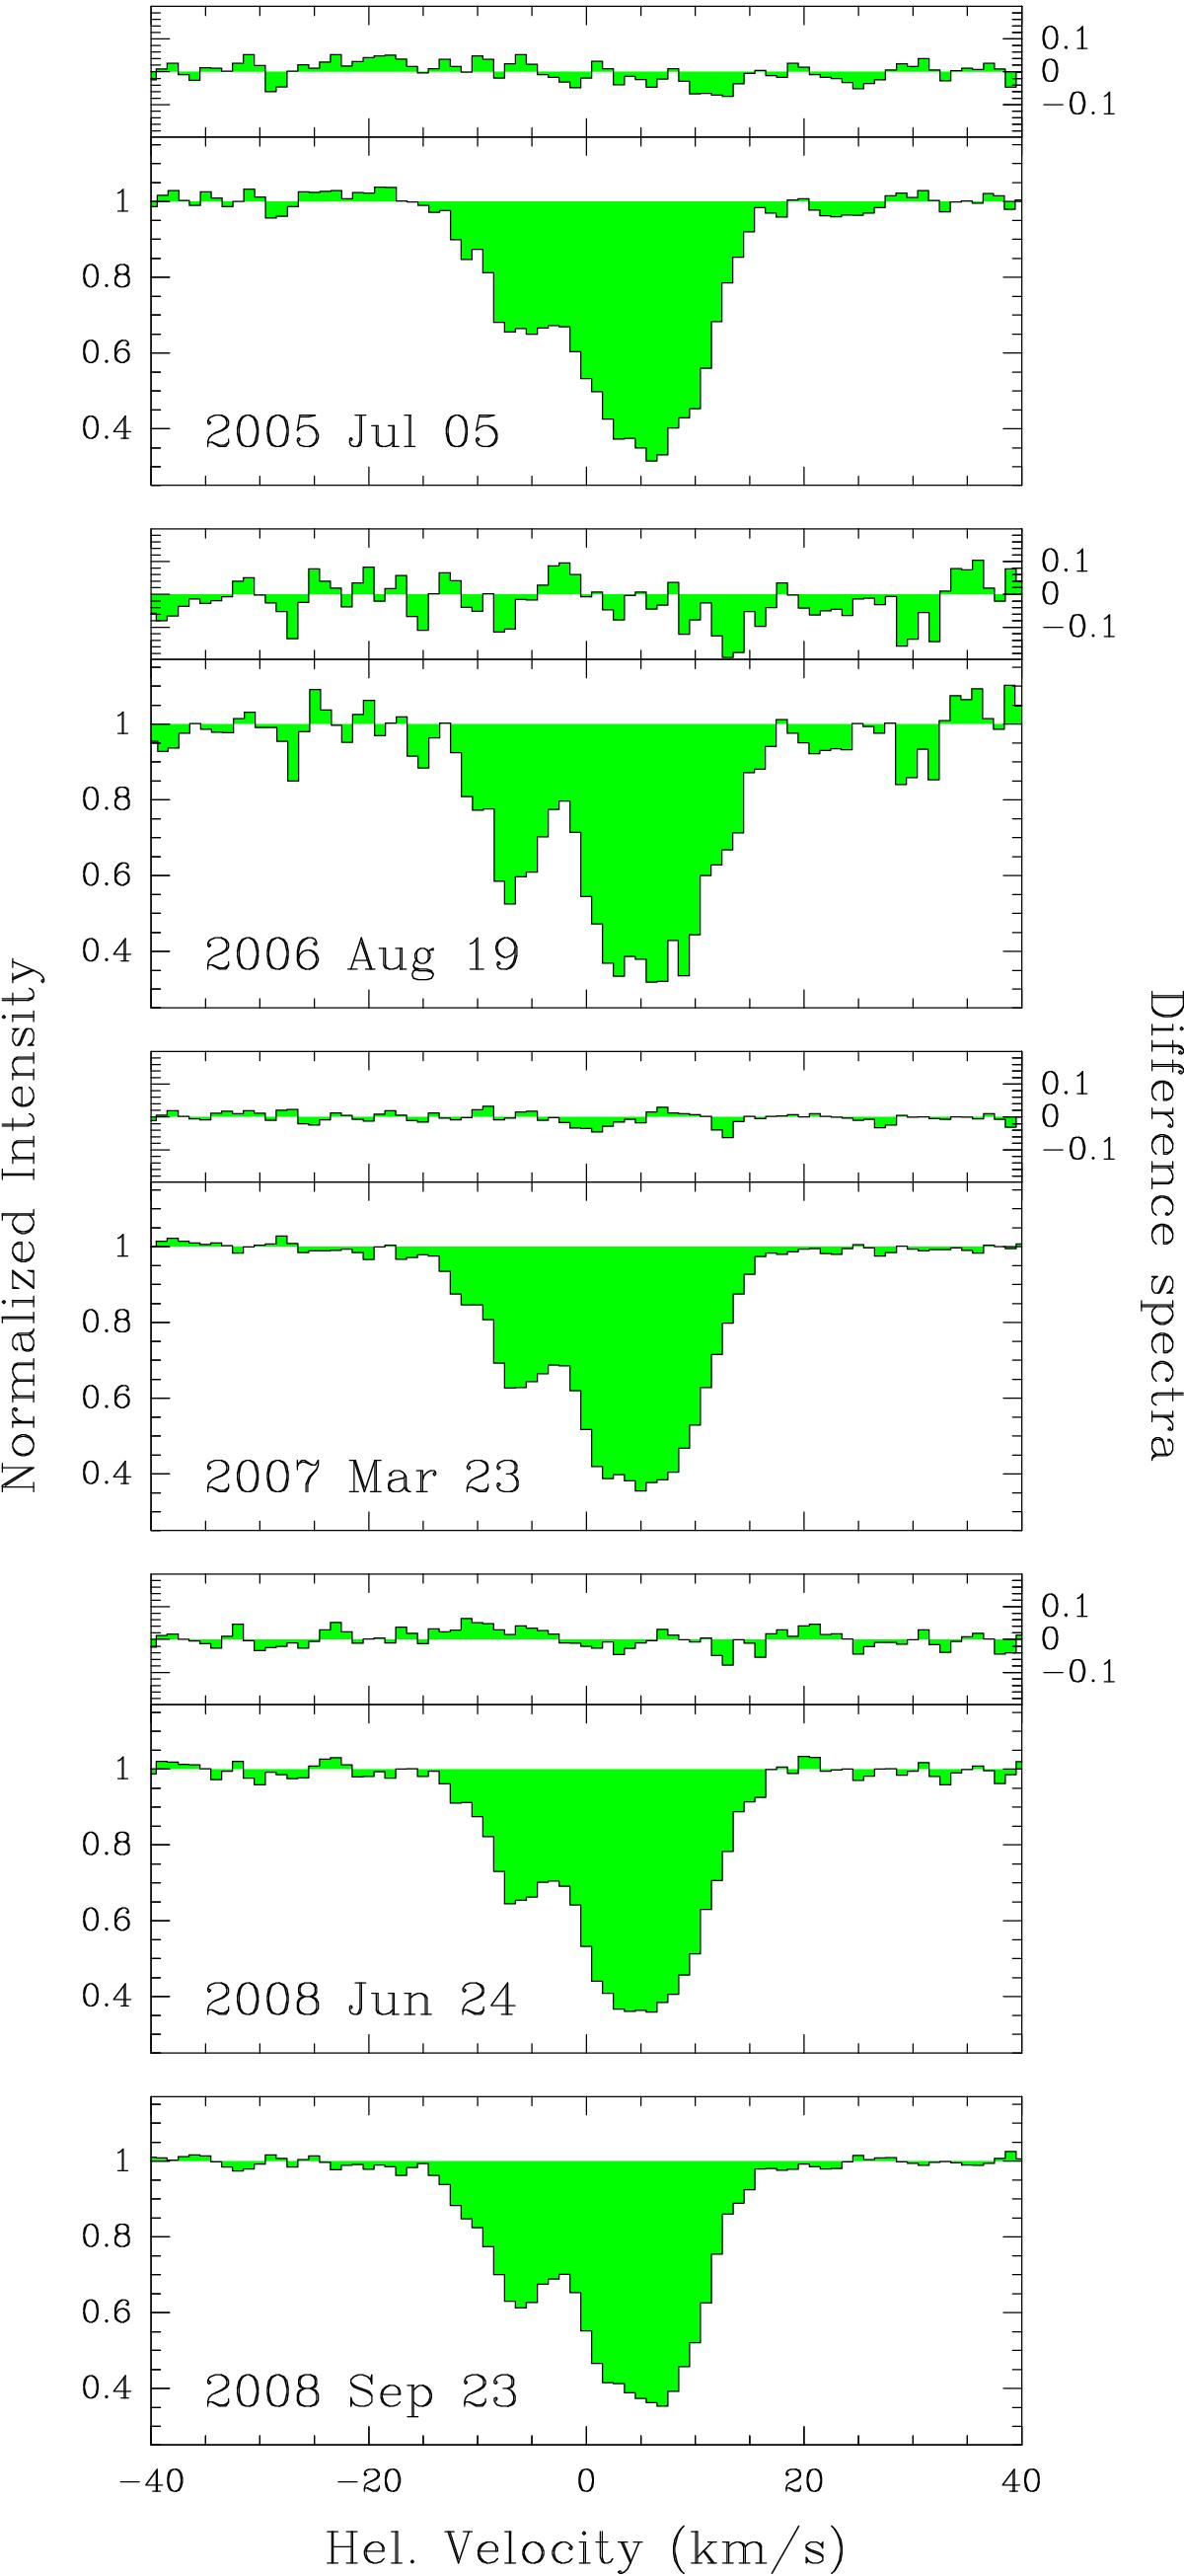
Spectra of the HCN J = 2–1 absorption toward B 0218+357 at different epochs between 2005 and 2008. Difference spectra are also shown with respect to the last (and best signal-to-noise ratio) spectrum obtained on 2008 Sept. 23.
Current usage metrics show cumulative count of Article Views (full-text article views including HTML views, PDF and ePub downloads, according to the available data) and Abstracts Views on Vision4Press platform.
Data correspond to usage on the plateform after 2015. The current usage metrics is available 48-96 hours after online publication and is updated daily on week days.
Initial download of the metrics may take a while.