Fig. 5
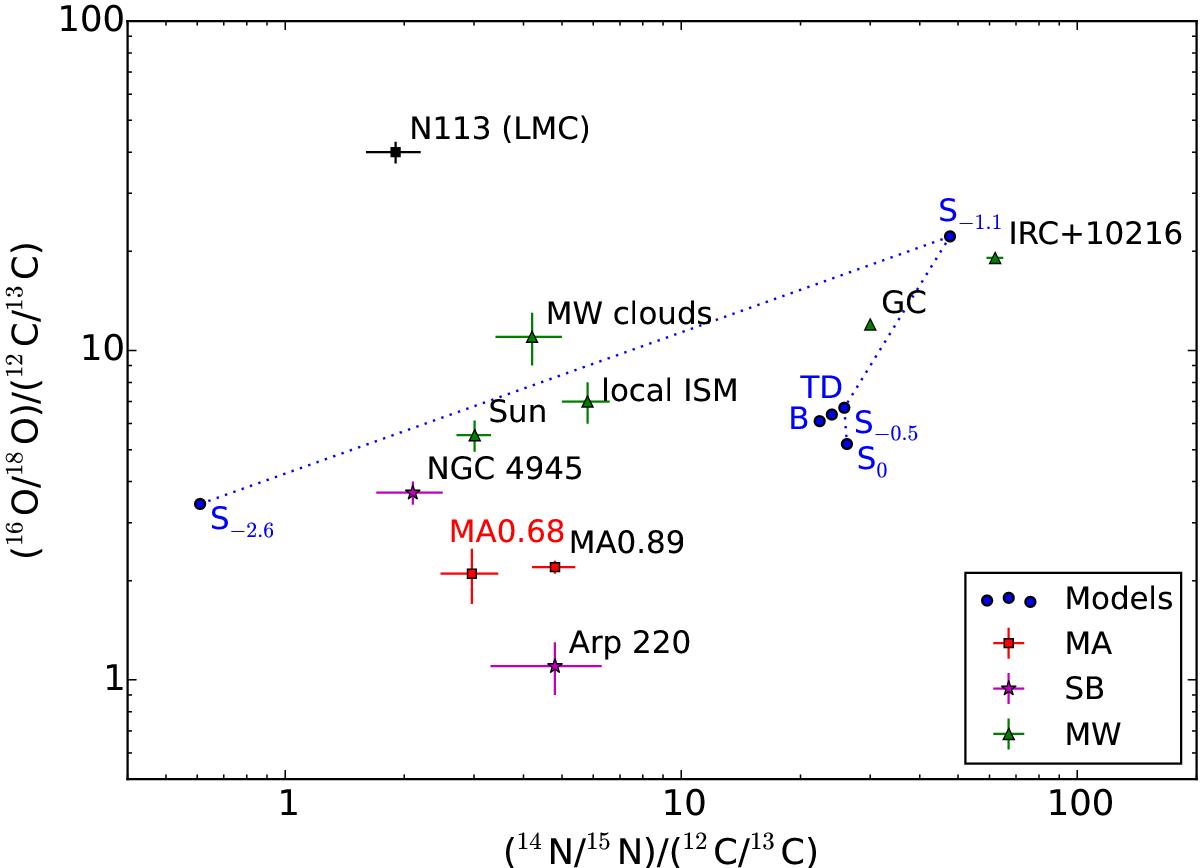
16O/18O vs. 14N/15N ratios, both normalized by the 12C/13C ratio, for various astronomical sources. Our result for MA0.68 is in red, as is MA0.89 (MA), starburst galaxies are magenta stars (SB), Galactic sources are green triangles (MW), and the predictions from chemical evolution models in the solar neighborhood by Kobayashi et al. (2011) are in blue and labeled as SX, where X denotes the metallicity [Fe/H]. Their models for the bulge (B) and thick disk (TD), also in blue, are for [Fe / H] = −0.5 2.
Current usage metrics show cumulative count of Article Views (full-text article views including HTML views, PDF and ePub downloads, according to the available data) and Abstracts Views on Vision4Press platform.
Data correspond to usage on the plateform after 2015. The current usage metrics is available 48-96 hours after online publication and is updated daily on week days.
Initial download of the metrics may take a while.