Fig. 4
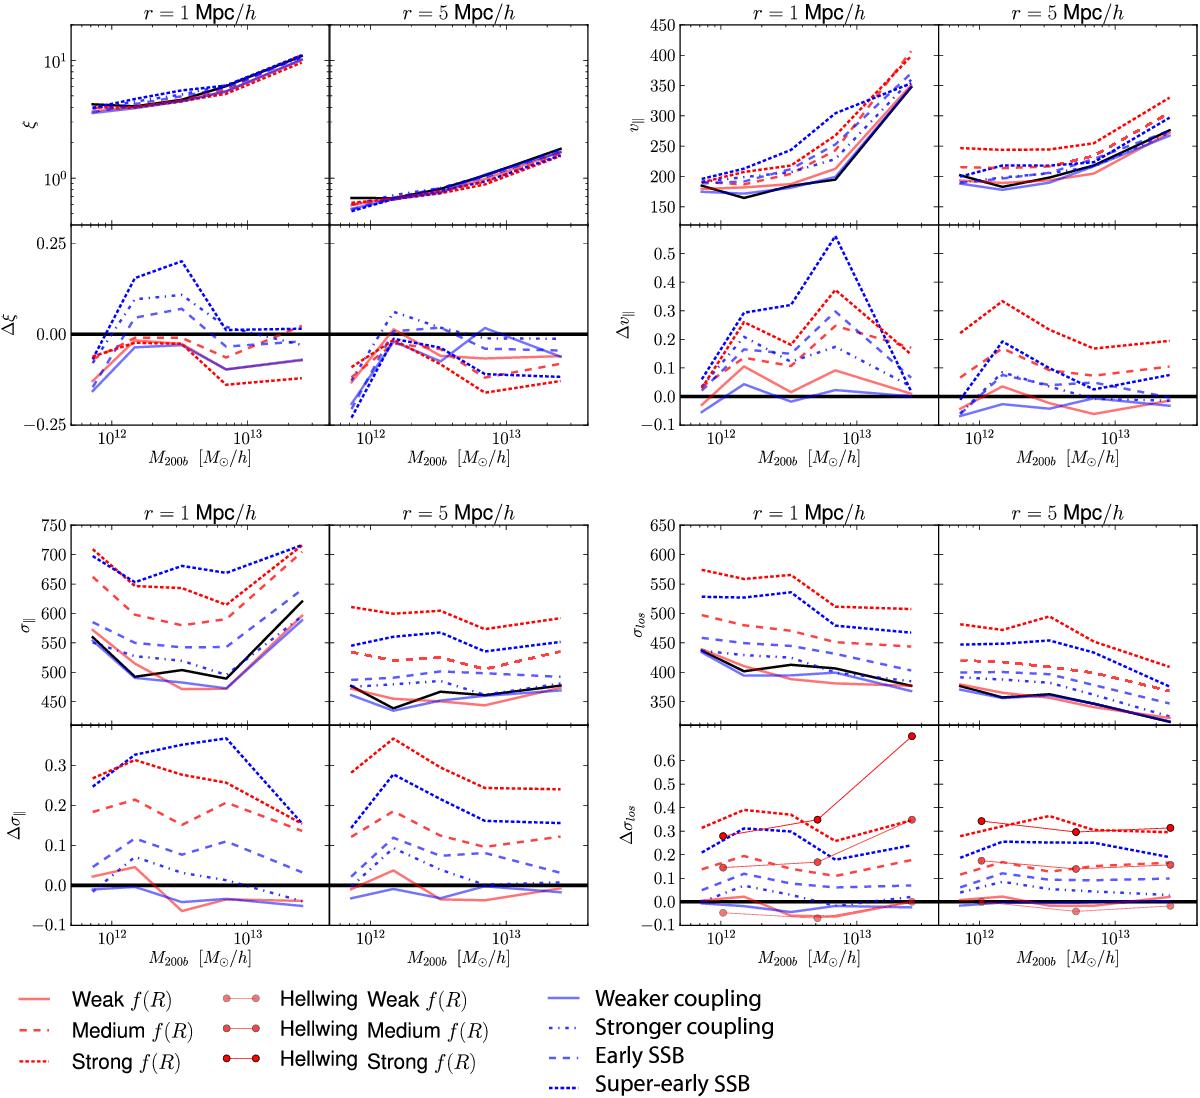
Comparison of statistics across models: ξ(r) (top left panel), v∥(r) (top right), σ∥(r) (bottom left), and σlos(r) (bottom right). The left and right columns in each panel are for pair separations r = 1 and 5h-1 Mpc, respectively. The upper rows show absolute values of the statistics, while the lower rows show the fractional deviation from GR (ΔX = XMG/XGR−1 for quantity X). The red points are taken from the f(R) model results presented in Hellwing et al. (2014). (These authors binned in M200c, the mass measured at the radius where Δ = 200 with respect to critical density; throughout this paper, we have consistently used M200b, which is measured with respect to the background matter density. The difference in the curves when M200c is used is negligible, however.)
Current usage metrics show cumulative count of Article Views (full-text article views including HTML views, PDF and ePub downloads, according to the available data) and Abstracts Views on Vision4Press platform.
Data correspond to usage on the plateform after 2015. The current usage metrics is available 48-96 hours after online publication and is updated daily on week days.
Initial download of the metrics may take a while.