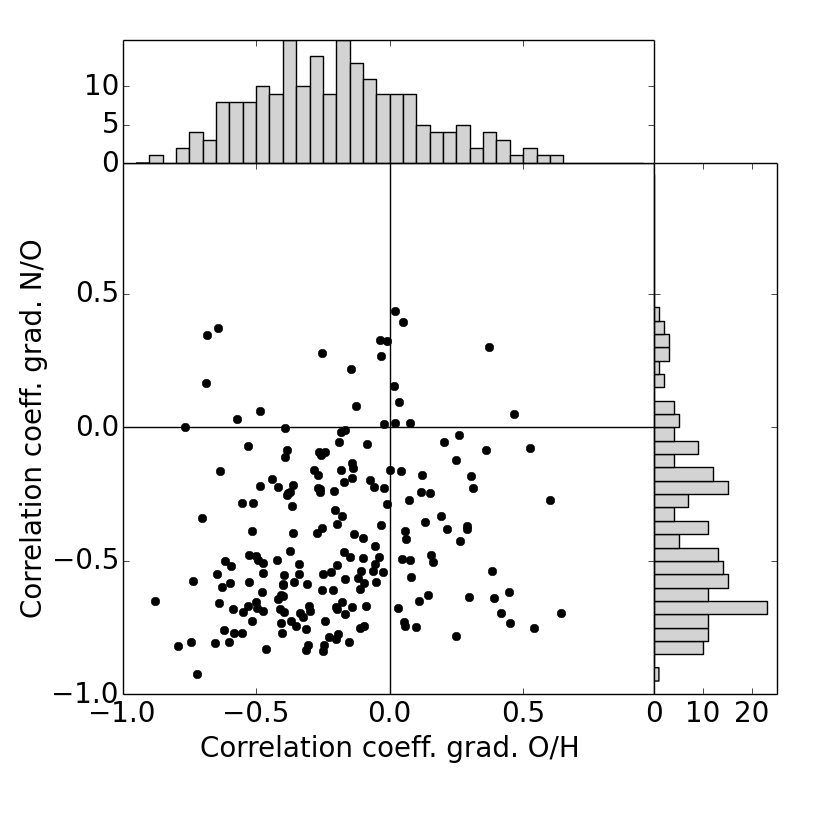
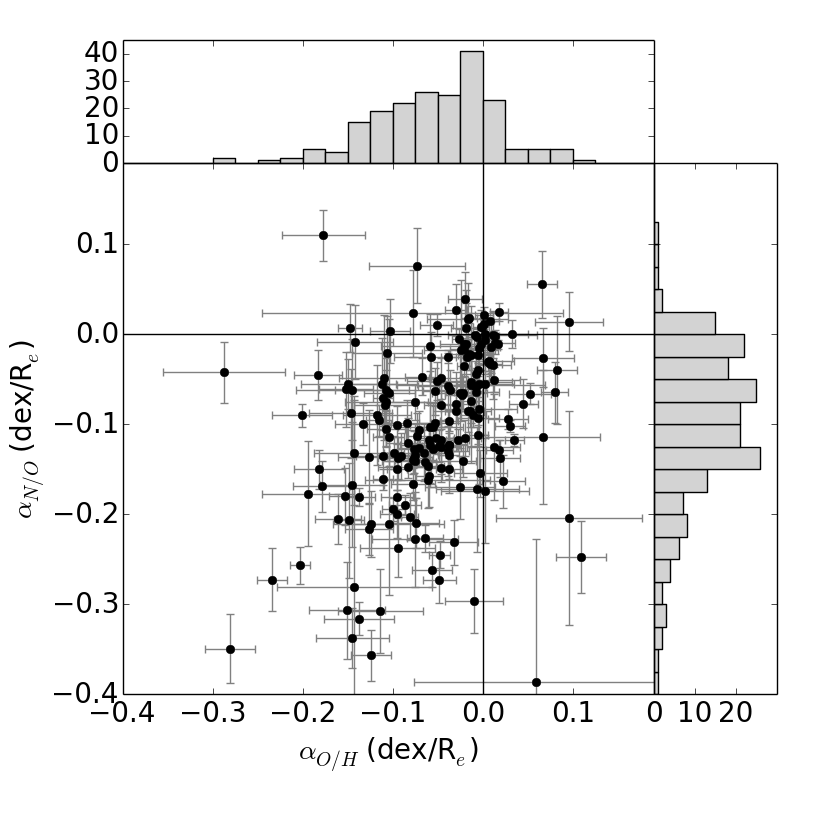
Fig. 9
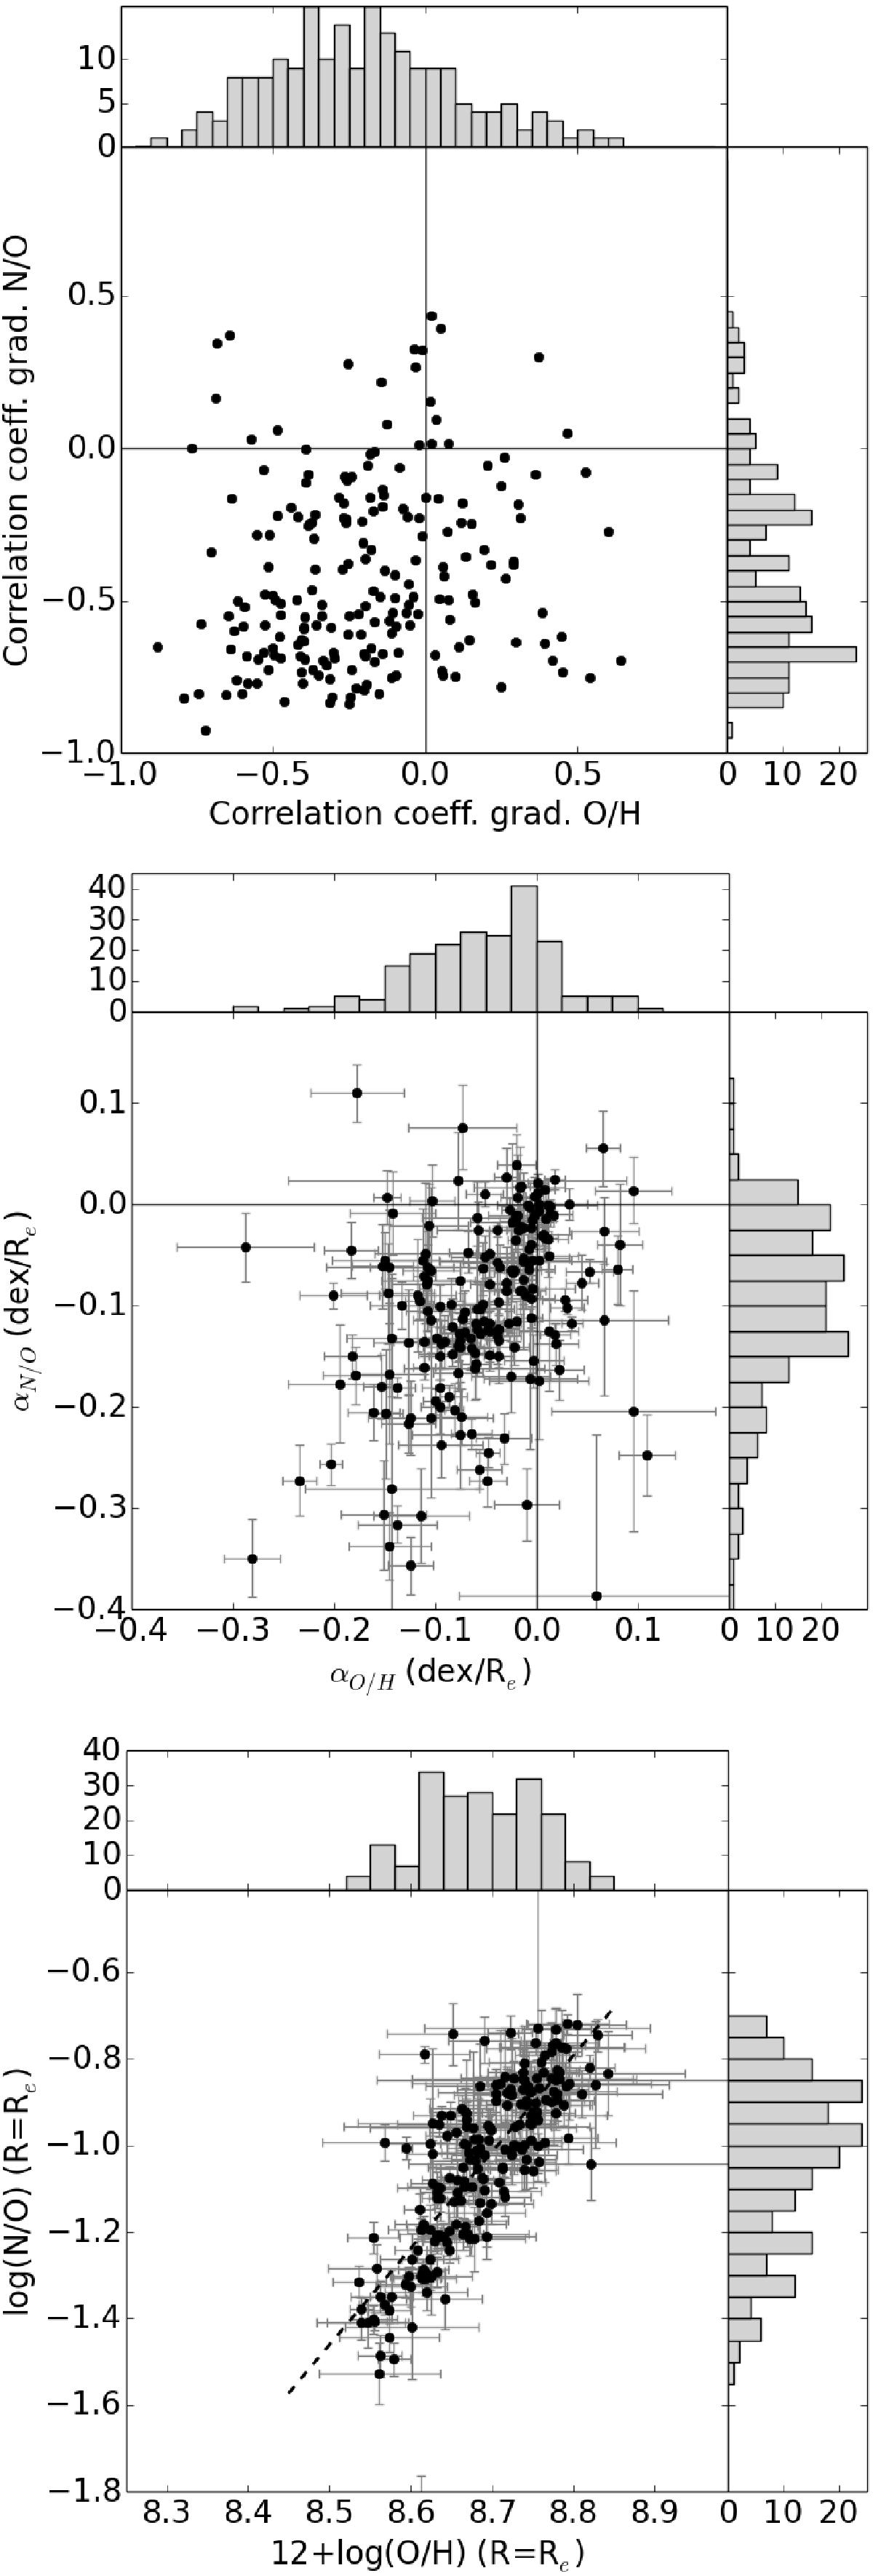
Histograms and relations of the properties derived from the linear fittings through the radial scale both for O/H and N/O in those galaxy discs of the CALIFA sample with enough star-forming H ii regions. From top to bottom: correlation coefficient, slope of the gradient, and predicted value at the effective radius of the galaxy.

Current usage metrics show cumulative count of Article Views (full-text article views including HTML views, PDF and ePub downloads, according to the available data) and Abstracts Views on Vision4Press platform.
Data correspond to usage on the plateform after 2015. The current usage metrics is available 48-96 hours after online publication and is updated daily on week days.
Initial download of the metrics may take a while.