Fig. 8
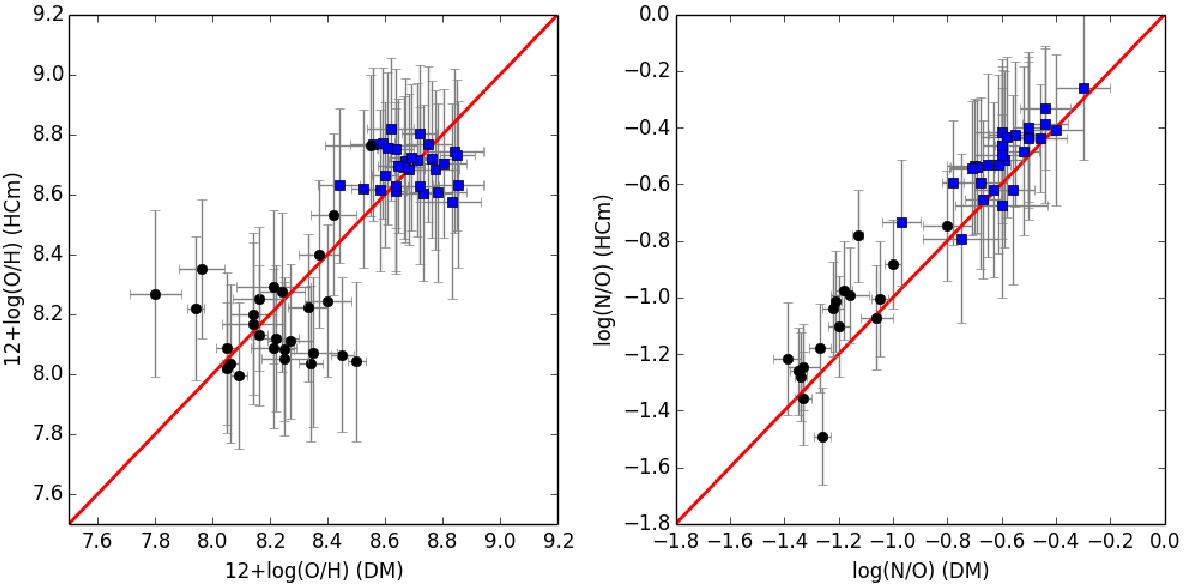
Comparison between abundances derived from the direct method and from HCm in the sample of H ii regions of M51 (Croxall et al. 2015) as blue squares and M101 (Croxall et al. 2016) as black circles for O/H (left) and N/O (right). The red solid lines represent the 1:1 relation in both panels.
Current usage metrics show cumulative count of Article Views (full-text article views including HTML views, PDF and ePub downloads, according to the available data) and Abstracts Views on Vision4Press platform.
Data correspond to usage on the plateform after 2015. The current usage metrics is available 48-96 hours after online publication and is updated daily on week days.
Initial download of the metrics may take a while.