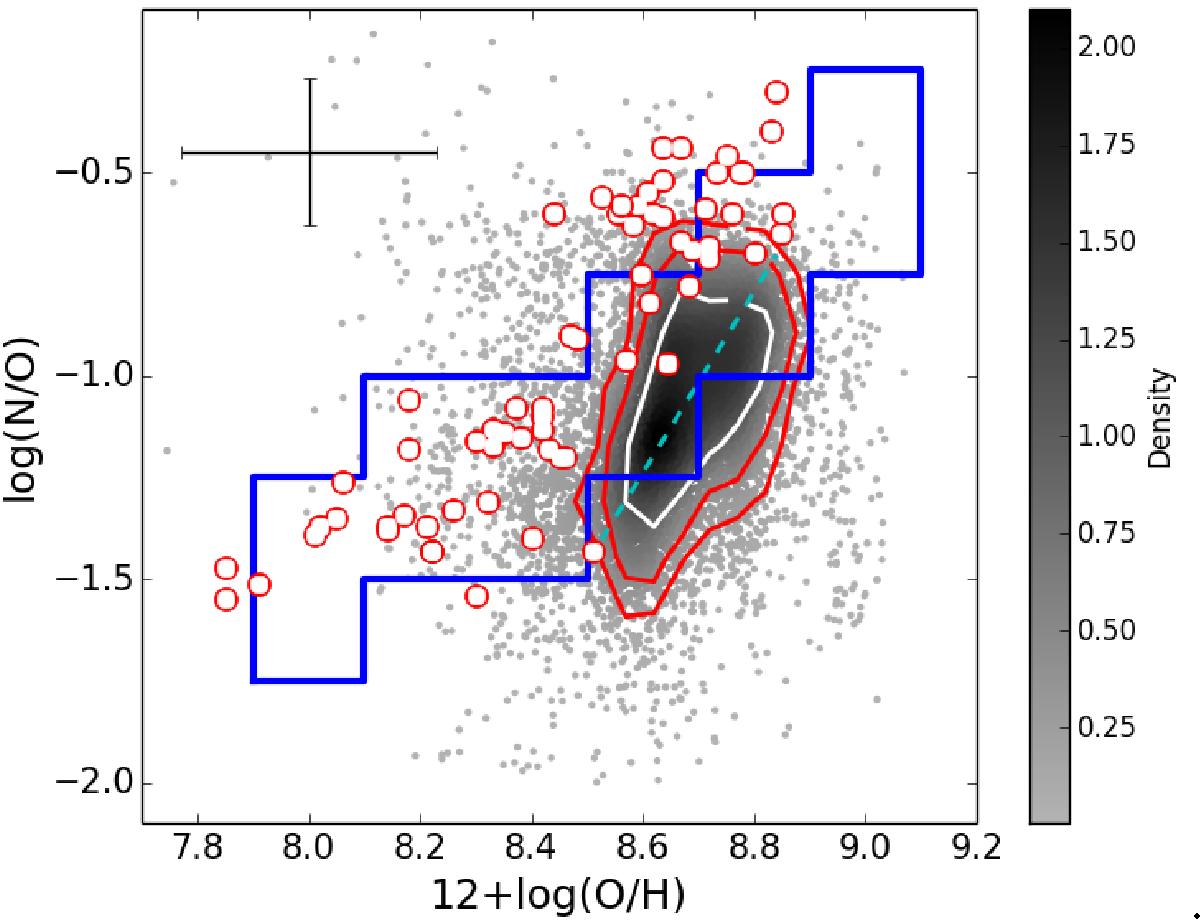
Fig. 7

Relation between O/H and N/O as derived from HCm for all the star-forming H ii regions analysed in the CALIFA sample. Density of points over the mean value are coded by the colours. The solid lines represent the 1σ (white), 2σ, and 3σ (red) contours, while the dashed line shows the linear fitting obtained in the lower panel of Fig. 9. Finally, the cyan solid line encompasses the space of models used by HCm to calculate O/H without a previous determination of N/O that is taken from the position of objects with a direct chemical abundance in Pérez-Montero (2014). The upper cross represents the typical errors associated with the derivation of abundances using HCm. The white points correspond to H ii regions in other O/H regimes whose abundances were calculated from the direct method taken from Croxall et al. (2015, 2016).
Current usage metrics show cumulative count of Article Views (full-text article views including HTML views, PDF and ePub downloads, according to the available data) and Abstracts Views on Vision4Press platform.
Data correspond to usage on the plateform after 2015. The current usage metrics is available 48-96 hours after online publication and is updated daily on week days.
Initial download of the metrics may take a while.


