Fig. 5
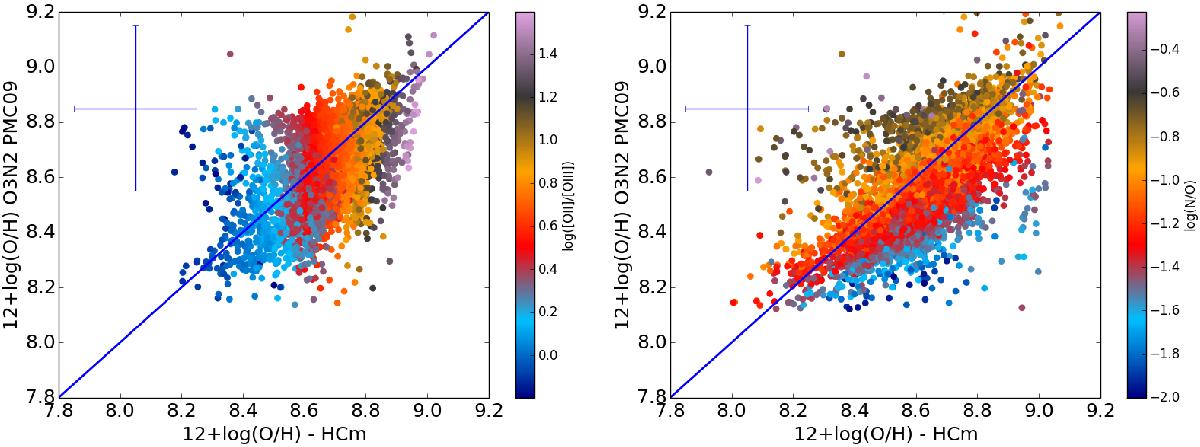
Comparison between O/H derived from HCm and from the empirical calibration of the O3N2 parameter given by Pérez-Montero & Contini (2009). The blue solid lines represent the 1:1 relation. The left panel has a colour scale for the [O ii]/[O iii] ratio and the right panel for N/O. For the sake of consistency, the number of points in left panel is lower because [O ii] lines were not used for the derivation of O/H. The upper left crosses represent the standard deviations of the residuals to the direct method of both methods as compared to the direct method carried out by Pérez-Montero & Contini (2009) and Pérez-Montero (2014).
Current usage metrics show cumulative count of Article Views (full-text article views including HTML views, PDF and ePub downloads, according to the available data) and Abstracts Views on Vision4Press platform.
Data correspond to usage on the plateform after 2015. The current usage metrics is available 48-96 hours after online publication and is updated daily on week days.
Initial download of the metrics may take a while.