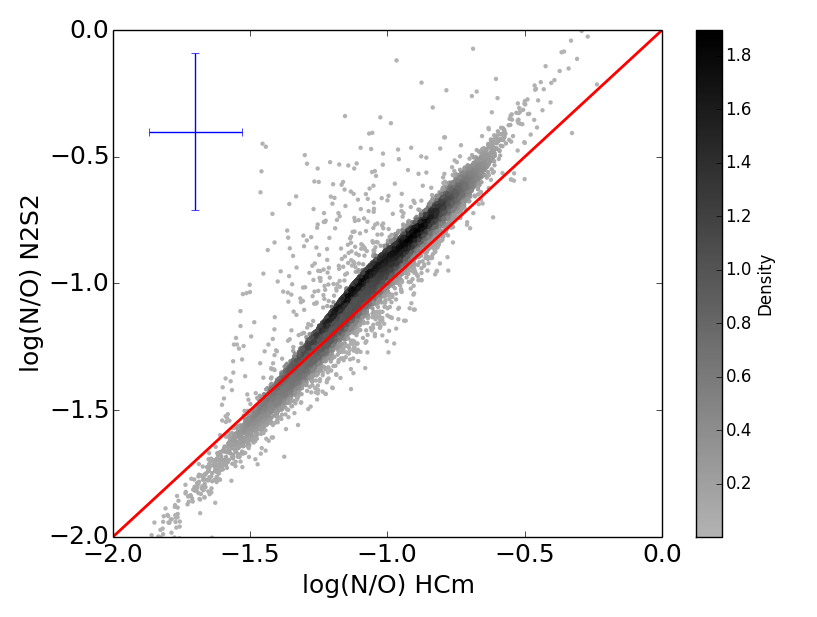
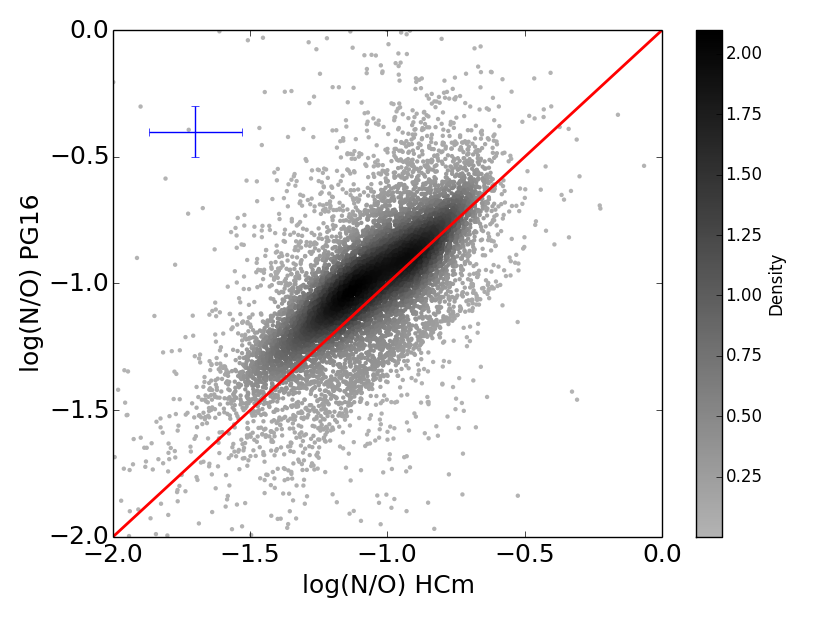
Fig. 4
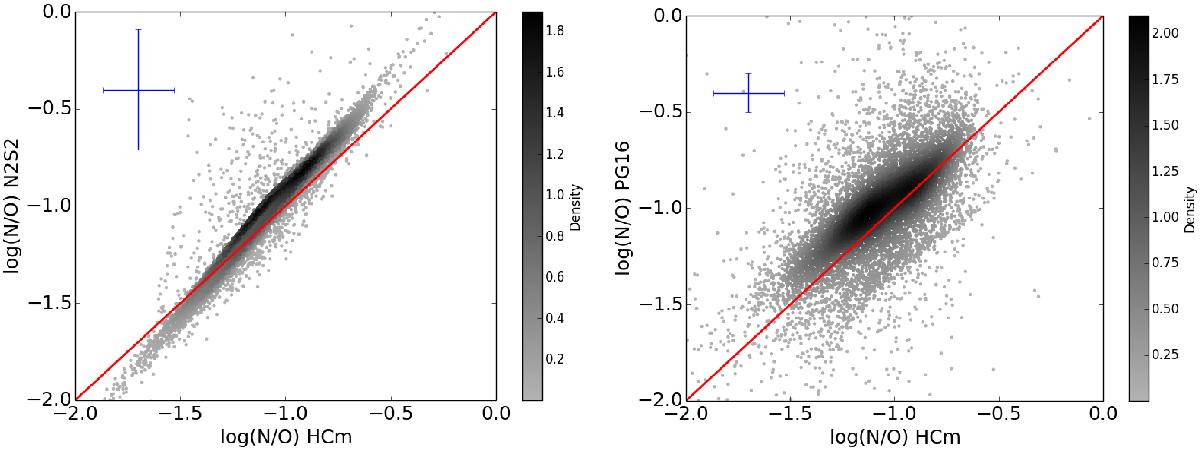
Comparison between N/O derived from HCm and from different strong-line methods. At left, for all selected H ii regions, with the N2S2 parameter calibrated by Pérez-Montero & Contini (2009). At right, the calibration by Pilyugin & Grebel (2016) based on [N ii] and [O ii] emission lines for those regions whose [O ii] lines were used. Density of points over the mean value are represented according to the colour bar. The red solid line represents the 1:1 relation. The upper left crosses represent the standard deviation of the residuals to the direct method as carried out by Pérez-Montero & Contini (2009) and Pérez-Montero (2014).
Current usage metrics show cumulative count of Article Views (full-text article views including HTML views, PDF and ePub downloads, according to the available data) and Abstracts Views on Vision4Press platform.
Data correspond to usage on the plateform after 2015. The current usage metrics is available 48-96 hours after online publication and is updated daily on week days.
Initial download of the metrics may take a while.