Fig. 2
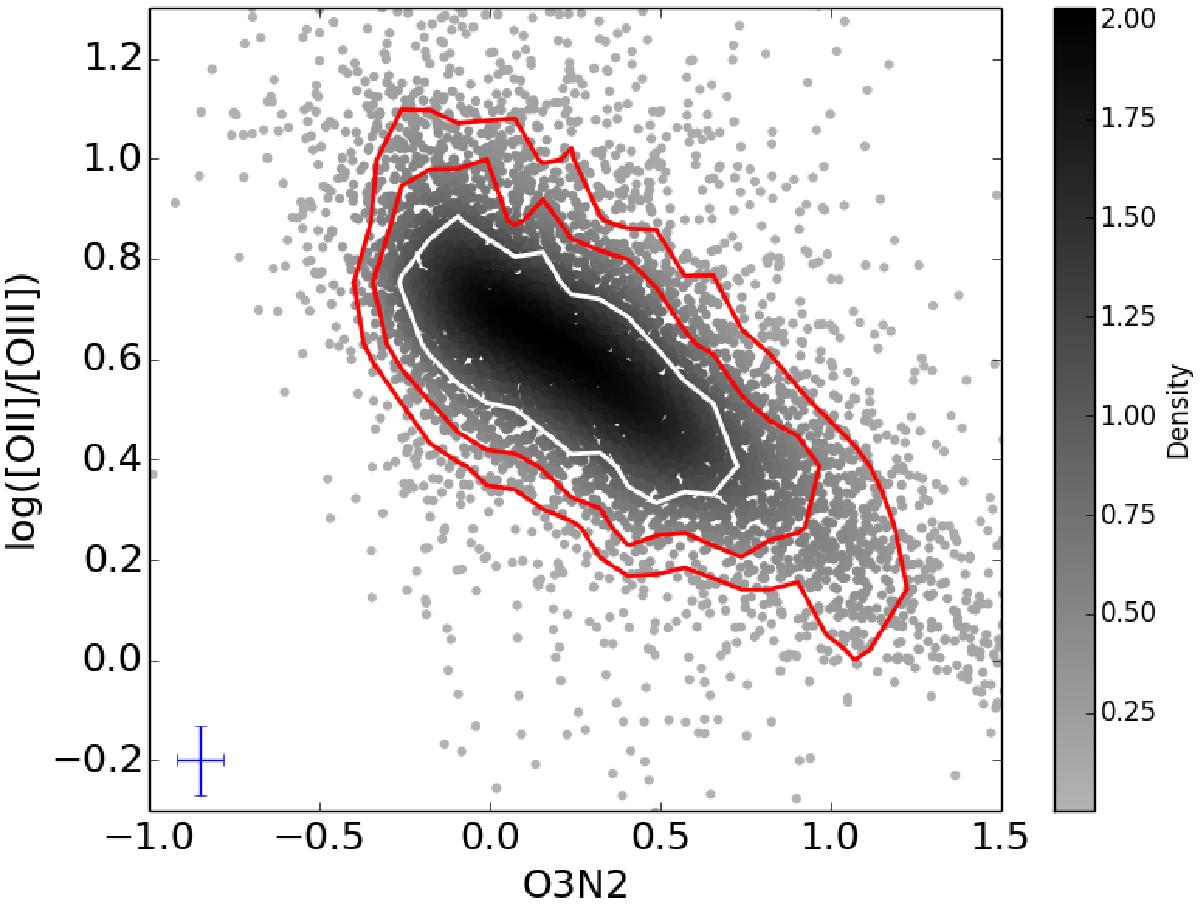
Relation between the index O3N2, which is a tracer of Z, and the emission line ratio [O ii]/[O iii], which is a tracer of the excitation, for those selected star-forming regions for which [O ii] lines were used for the calculation of chemical abundances. Density of points over the mean value are represented according to the colour bar. White solid line represents the 1σ contour, while red lines represent 2σ and 3σ contours. The left lower cross indicates the typical errors of the two ratios.
Current usage metrics show cumulative count of Article Views (full-text article views including HTML views, PDF and ePub downloads, according to the available data) and Abstracts Views on Vision4Press platform.
Data correspond to usage on the plateform after 2015. The current usage metrics is available 48-96 hours after online publication and is updated daily on week days.
Initial download of the metrics may take a while.