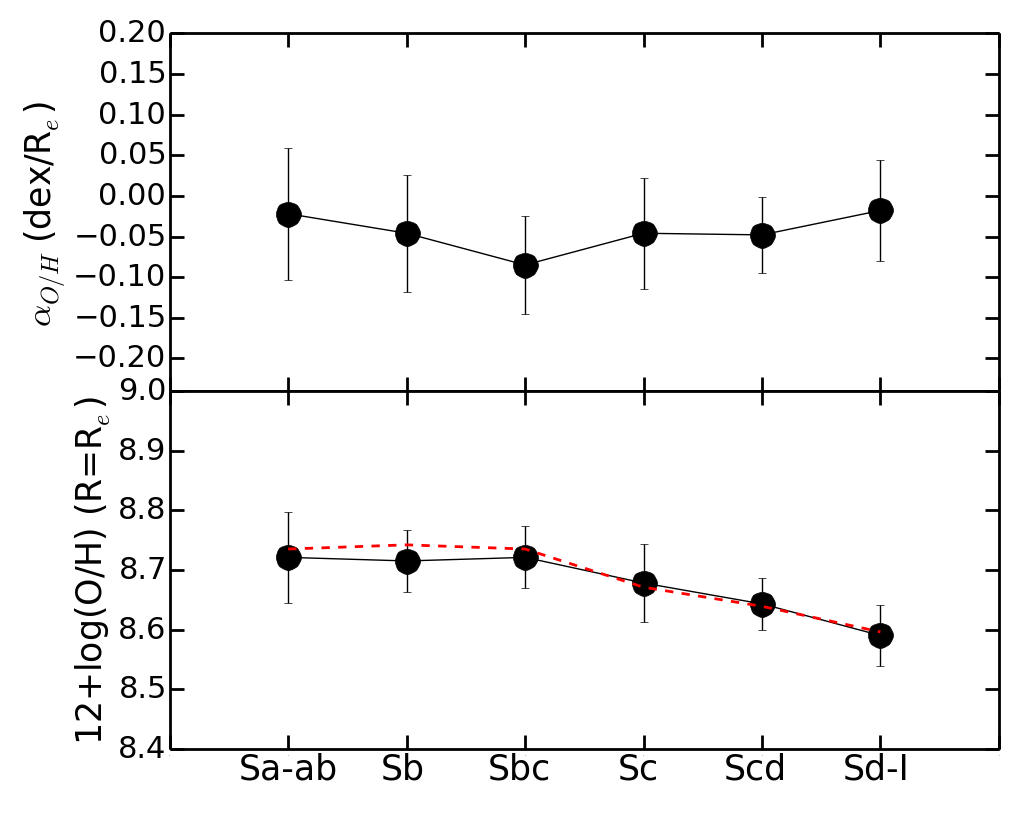
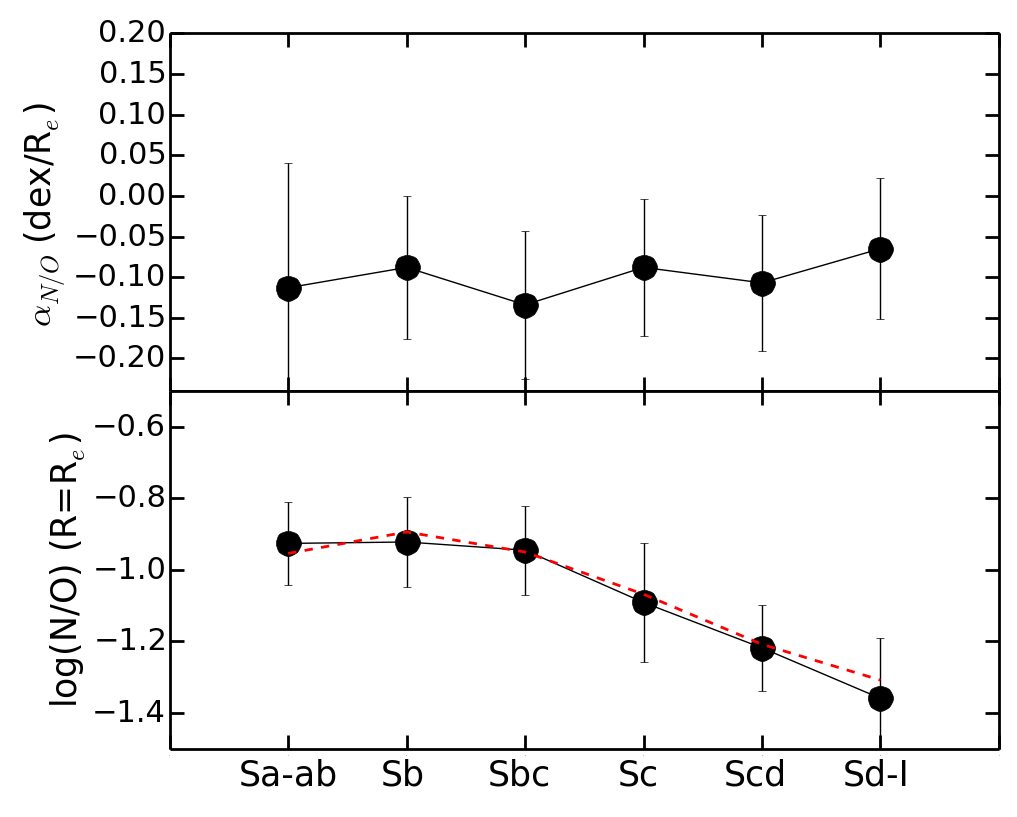
Fig. 19
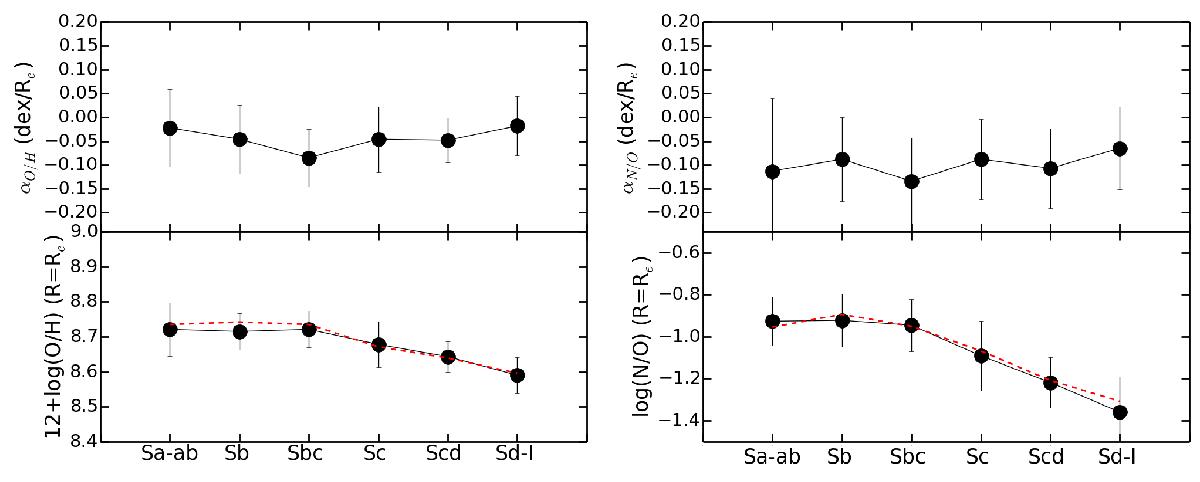
Average slopes and value at the effective radius of the linear fittings in the non-interacting analysed galaxies as a function of the morphological type for O/H (left panels) and N/O (right panels). The black solid lines connects the average points for each morphological type, while the red dashed lines correspond to the average typical abundance ratios found at the average stellar mass of each type.
Current usage metrics show cumulative count of Article Views (full-text article views including HTML views, PDF and ePub downloads, according to the available data) and Abstracts Views on Vision4Press platform.
Data correspond to usage on the plateform after 2015. The current usage metrics is available 48-96 hours after online publication and is updated daily on week days.
Initial download of the metrics may take a while.