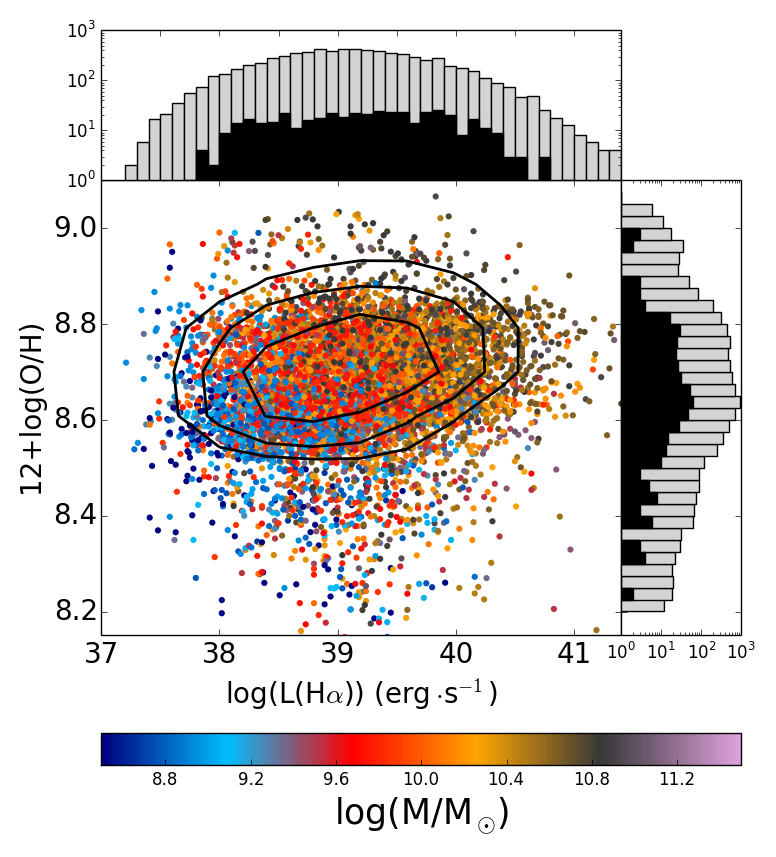
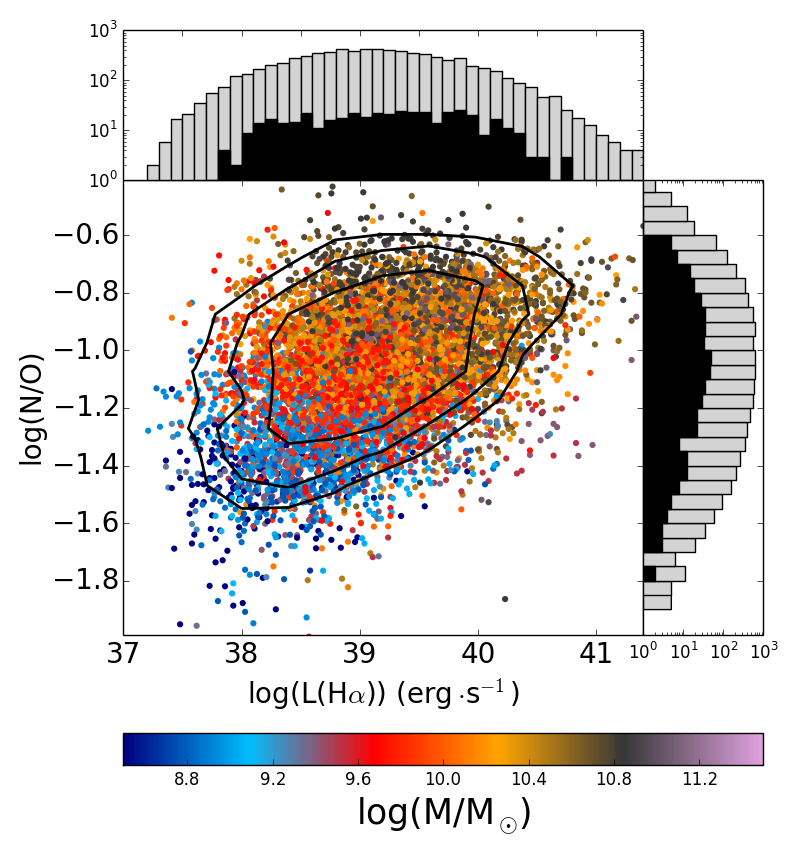
Fig. 16
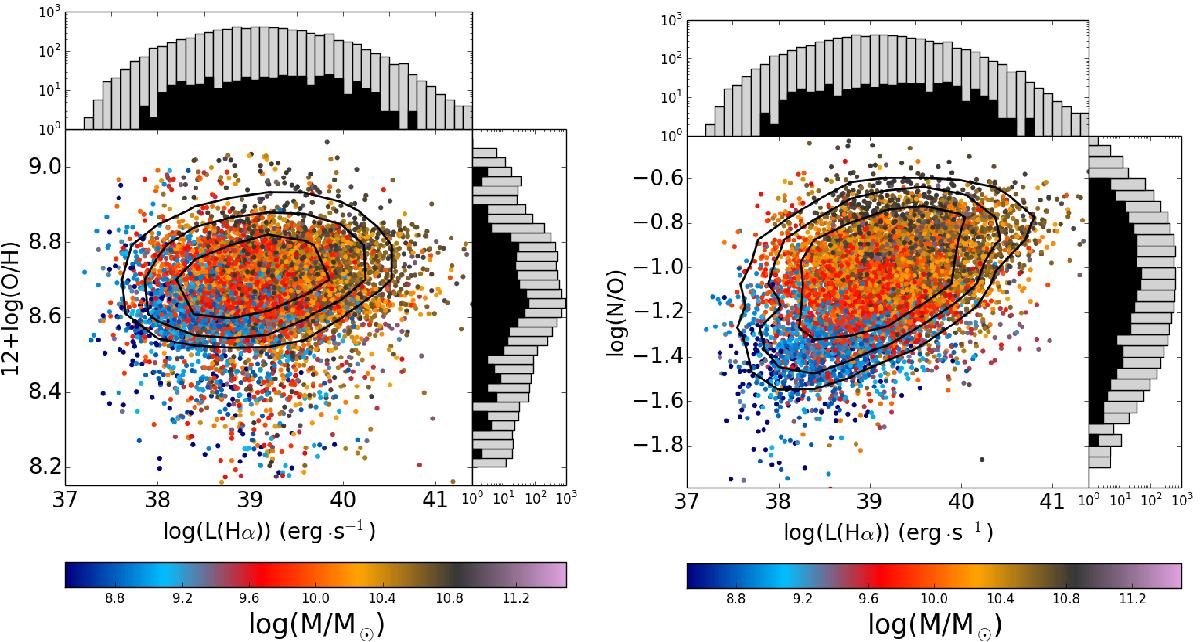
Relation between the Hα luminosity and O/H, at left, and N/O, at right, for the selected H ii regions of the galaxies for which a linear gradient was calculated. The colour encodes the total stellar mass of the galaxy where each H ii region is situated. The histograms show in logarithmic scales in all axes the distribution for all objects represented in the plot (white bars) and for those H ii regions in a galaxy with an inverted gradient (black bars). Colours indicate the density of points and solid lines represent the 1σ, 2σ, and 3σ contours.

Current usage metrics show cumulative count of Article Views (full-text article views including HTML views, PDF and ePub downloads, according to the available data) and Abstracts Views on Vision4Press platform.
Data correspond to usage on the plateform after 2015. The current usage metrics is available 48-96 hours after online publication and is updated daily on week days.
Initial download of the metrics may take a while.