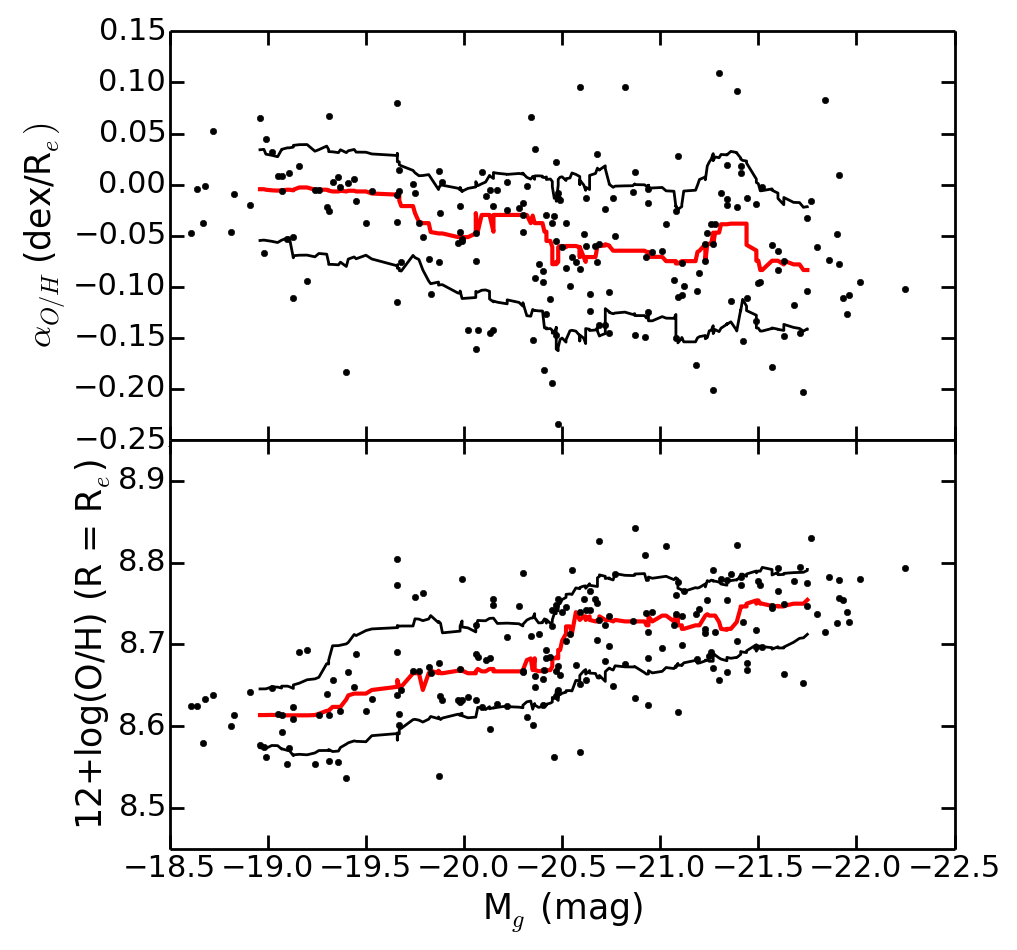
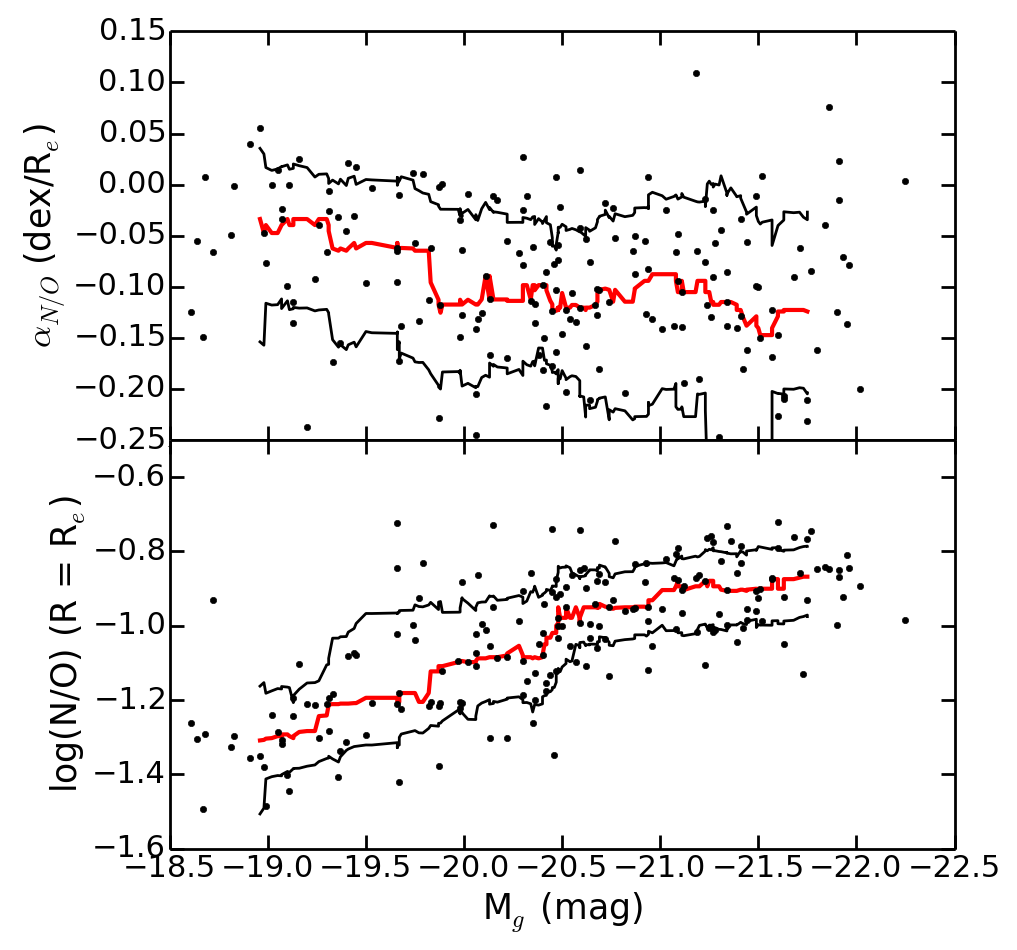
Fig. 12
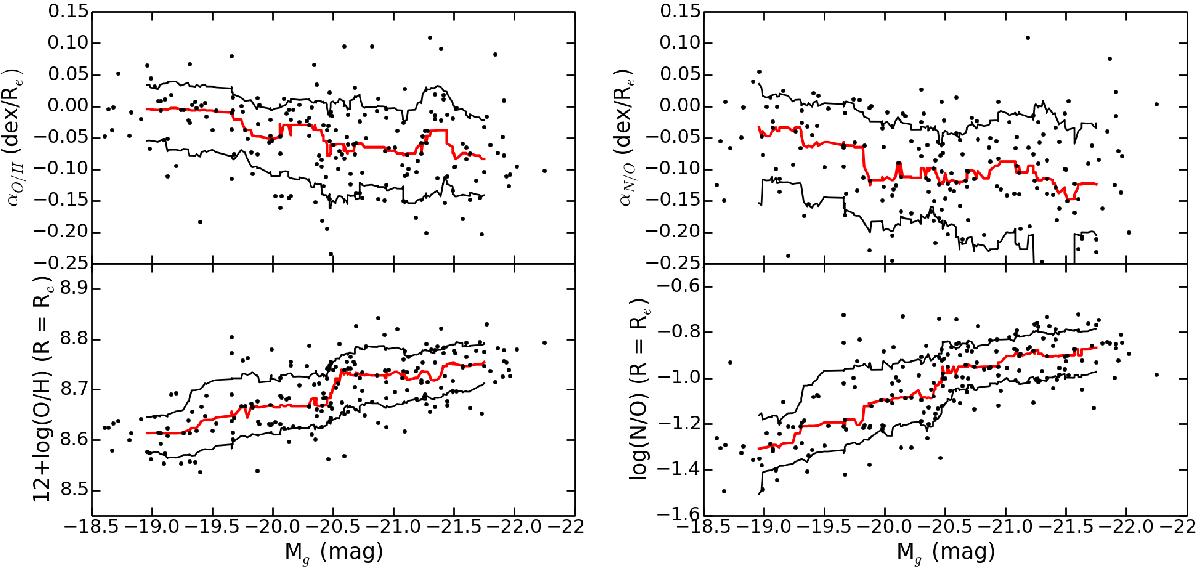
Relation between the absolute luminosity in the g band and the derived slopes and characteristic values at the effective radius for O/H (left panels) and N/O (right panels). The red solid line represents the running median for bins of 25 objects, and the black solid lines the 1σ above and below the averages in the same bins.
Current usage metrics show cumulative count of Article Views (full-text article views including HTML views, PDF and ePub downloads, according to the available data) and Abstracts Views on Vision4Press platform.
Data correspond to usage on the plateform after 2015. The current usage metrics is available 48-96 hours after online publication and is updated daily on week days.
Initial download of the metrics may take a while.