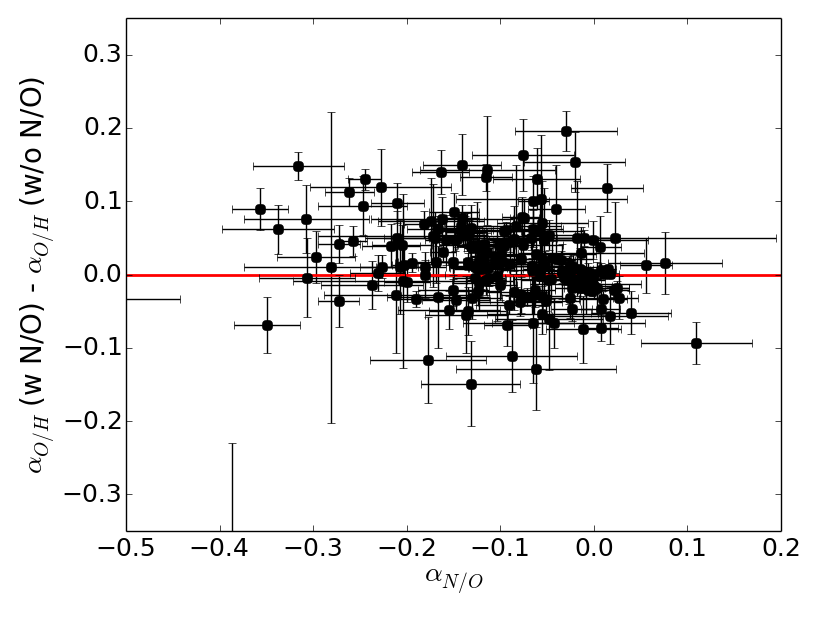
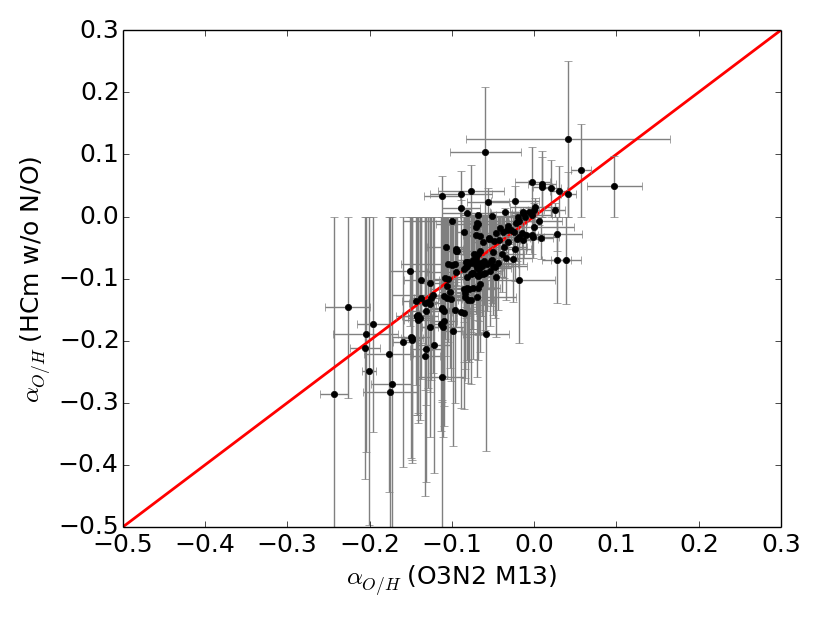
Fig. 10
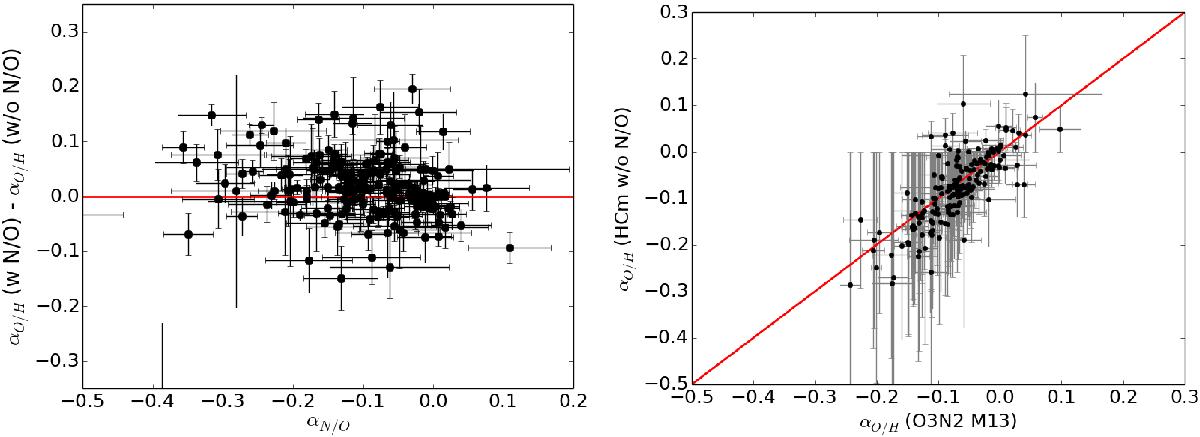
At left, difference as a function of the N/O slope of the O/H slopes calculated with a previous N/O calculation and the same slopes calculated assuming a given O/H-N/O relation for all the analysed CALIFA galaxies. The red solid line represents the zero value. At right, comparison between the O/H slopes calculated using this last approach with the same slopes calculated using the O3N2 parameter as calibrated by Marino et al. (2013). The red solid line represents the 1:1 relation. All slopes are expressed in dex/Re.
Current usage metrics show cumulative count of Article Views (full-text article views including HTML views, PDF and ePub downloads, according to the available data) and Abstracts Views on Vision4Press platform.
Data correspond to usage on the plateform after 2015. The current usage metrics is available 48-96 hours after online publication and is updated daily on week days.
Initial download of the metrics may take a while.