Fig. 1
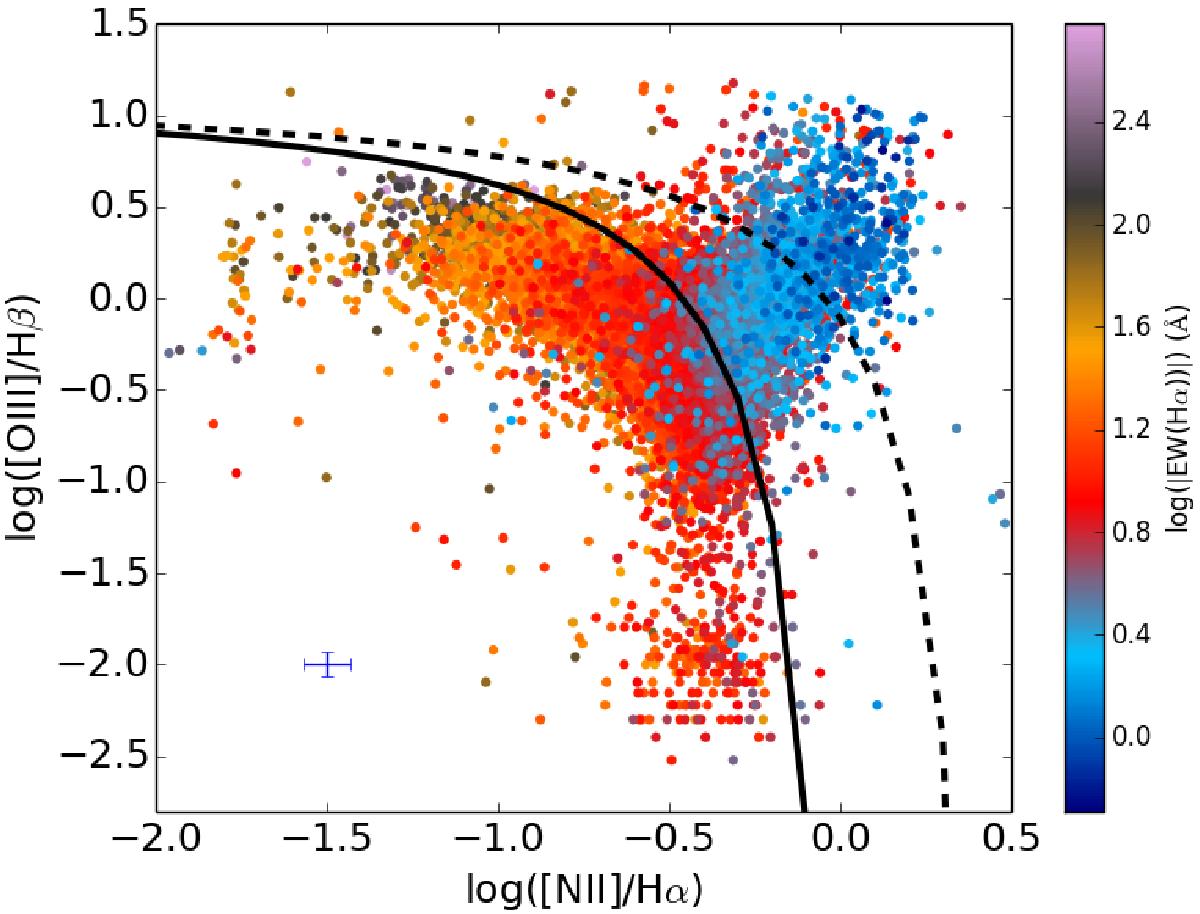
[O iii]/Hβ against [N ii]/Hα relation, one of the BPT diagrams, for the 15 757 extracted emission-line regions in the analysed CALIFA galaxies. Colour scale shows the Hα equivalent width. The solid black line represents the empirical curve from Kauffmann et al. (2003) to divide objects ionised by massive stars and by non-thermal processes. The dashed line is the theoretical curve defined by Kewley et al. (2001). The lower left cross indicates the typical associated error in each axes.
Current usage metrics show cumulative count of Article Views (full-text article views including HTML views, PDF and ePub downloads, according to the available data) and Abstracts Views on Vision4Press platform.
Data correspond to usage on the plateform after 2015. The current usage metrics is available 48-96 hours after online publication and is updated daily on week days.
Initial download of the metrics may take a while.