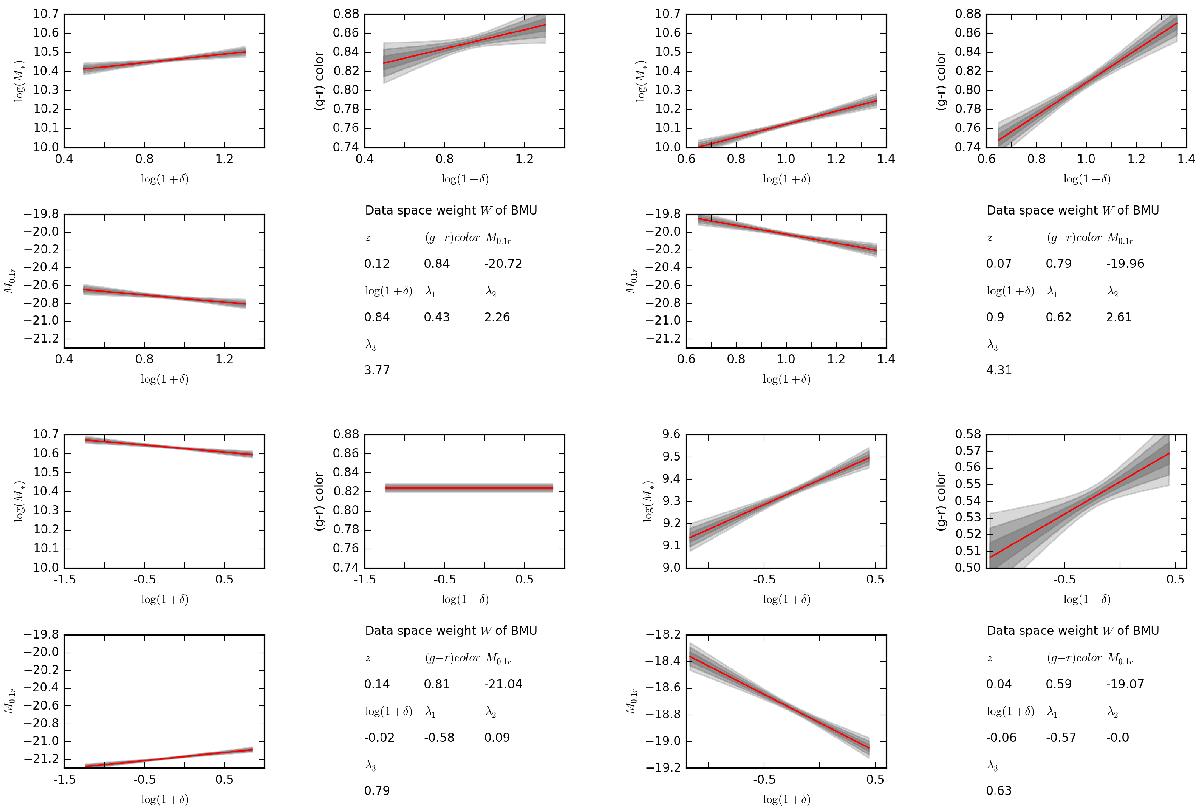
Fig. 8

Reconstructed correlation functions for different neuron-samples selected from the SDSS data sample by the SOM. In particular we depict the correlations for the logarithm of the stellar mass log (M∗), the r-band absolute magnitude M0.1r and the g-r color. In addition, each figure shows the data space position of the BMU corresponding to the sub-sample of data used for reconstruction. We see that the correlation of the stellar mass log (M∗) and the absolute magnitude M0.1r with the density field log (1 + δ) appear to be similar in different regions of the LSS. The upper two panels show reconstructions for sub-samples of heavy, red galaxies in high density regions classified as clusters (halos) according to the corresponding eigenvalues. The bottom-left panel belongs to heavy, red galaxies in low density regions classified as filaments and the bottom-right panel belongs to light, blue galaxies in regions classified as sheet (or filament since λ2 ≈ 0). We adjusted the range of the y-axis in the last panel in order to improve the visibility of the correlation structure. Colors are defined according to the color classification code of Li et al. (2006).
Current usage metrics show cumulative count of Article Views (full-text article views including HTML views, PDF and ePub downloads, according to the available data) and Abstracts Views on Vision4Press platform.
Data correspond to usage on the plateform after 2015. The current usage metrics is available 48-96 hours after online publication and is updated daily on week days.
Initial download of the metrics may take a while.


