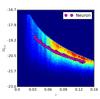
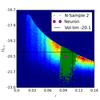
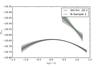
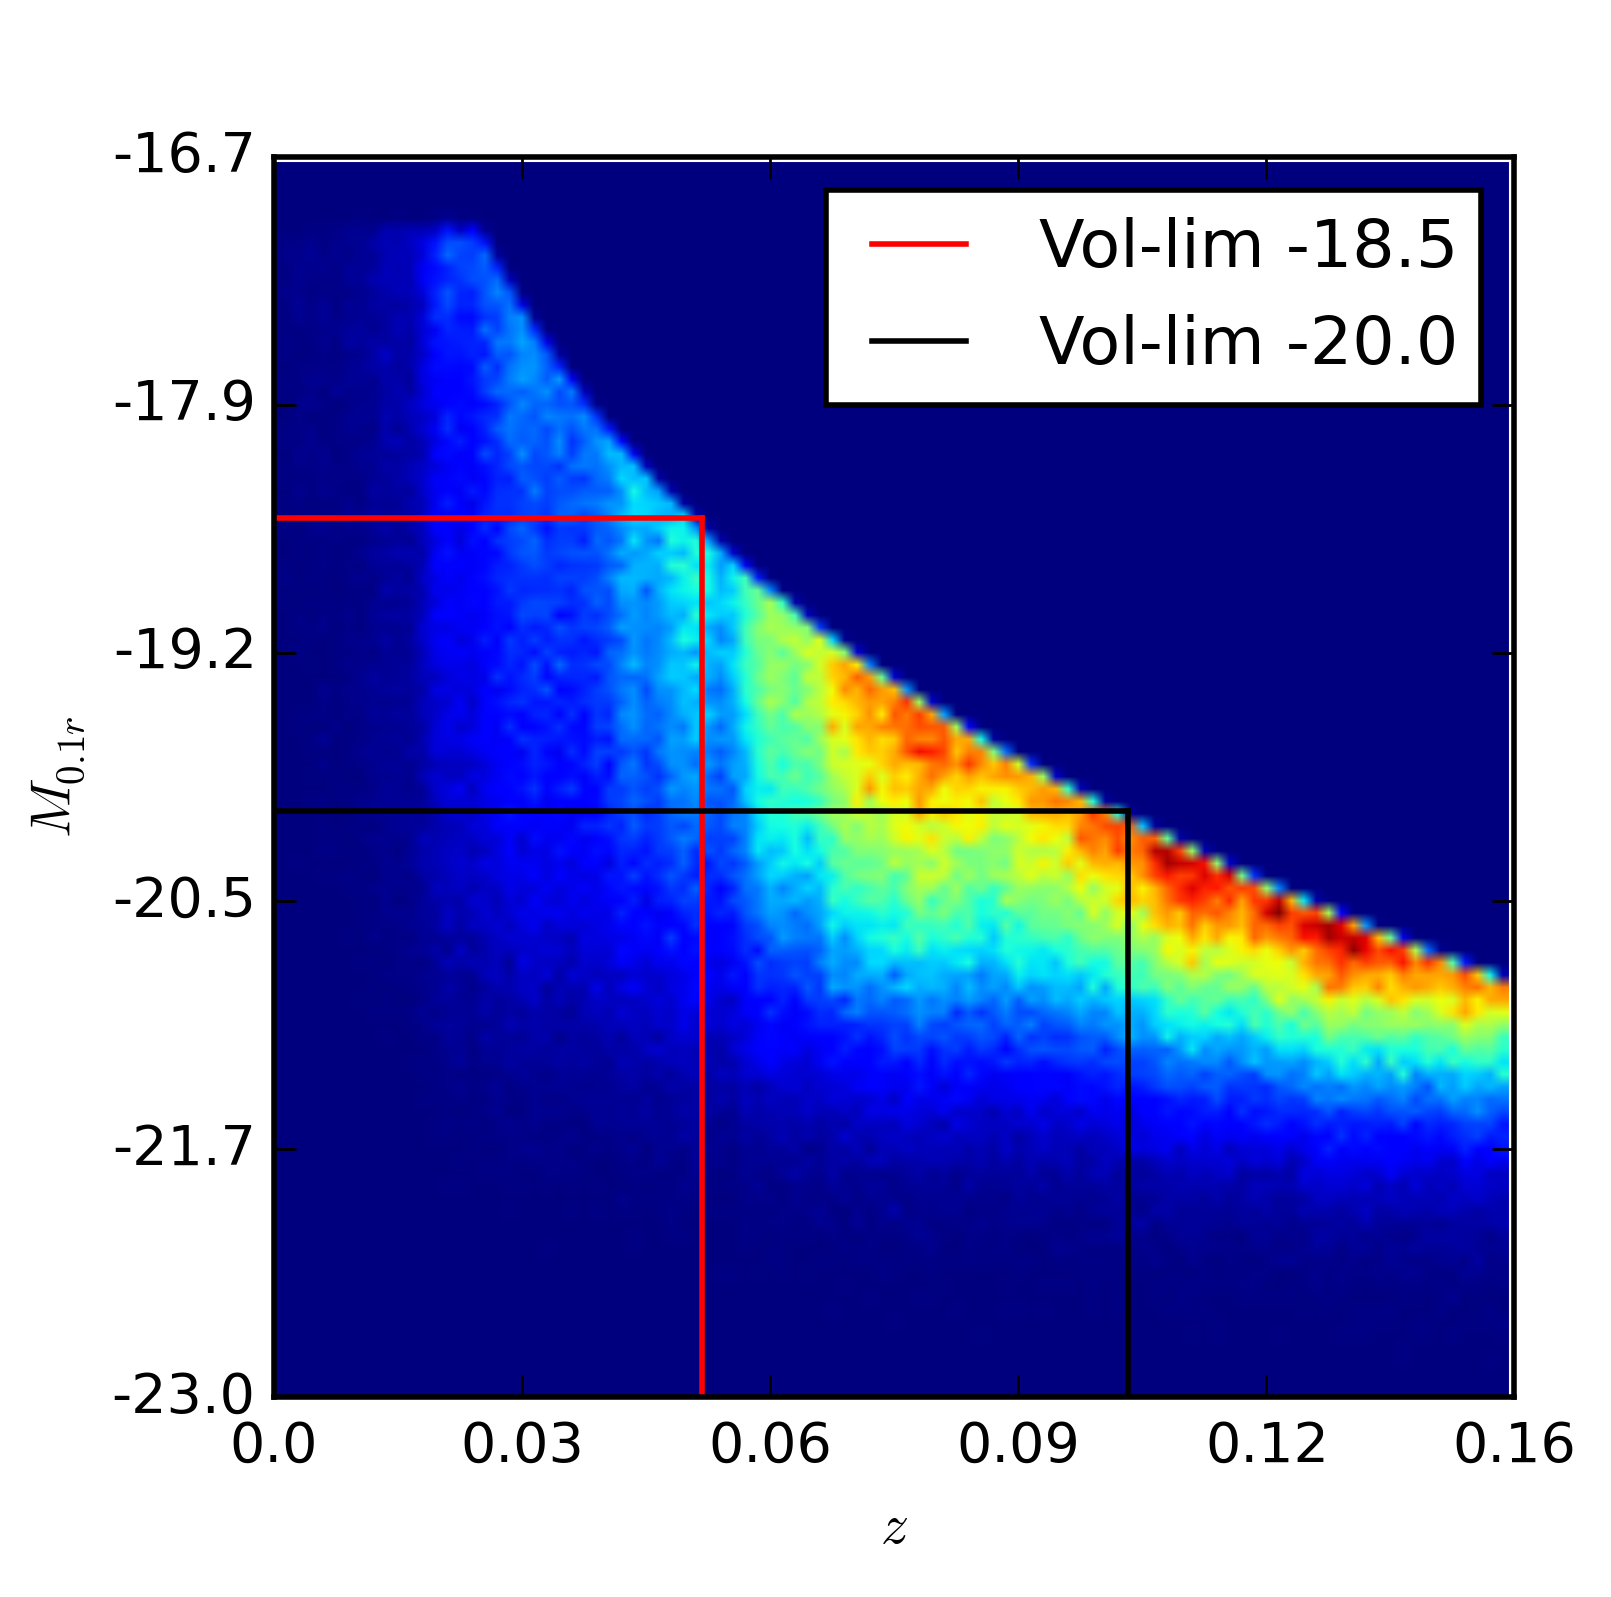
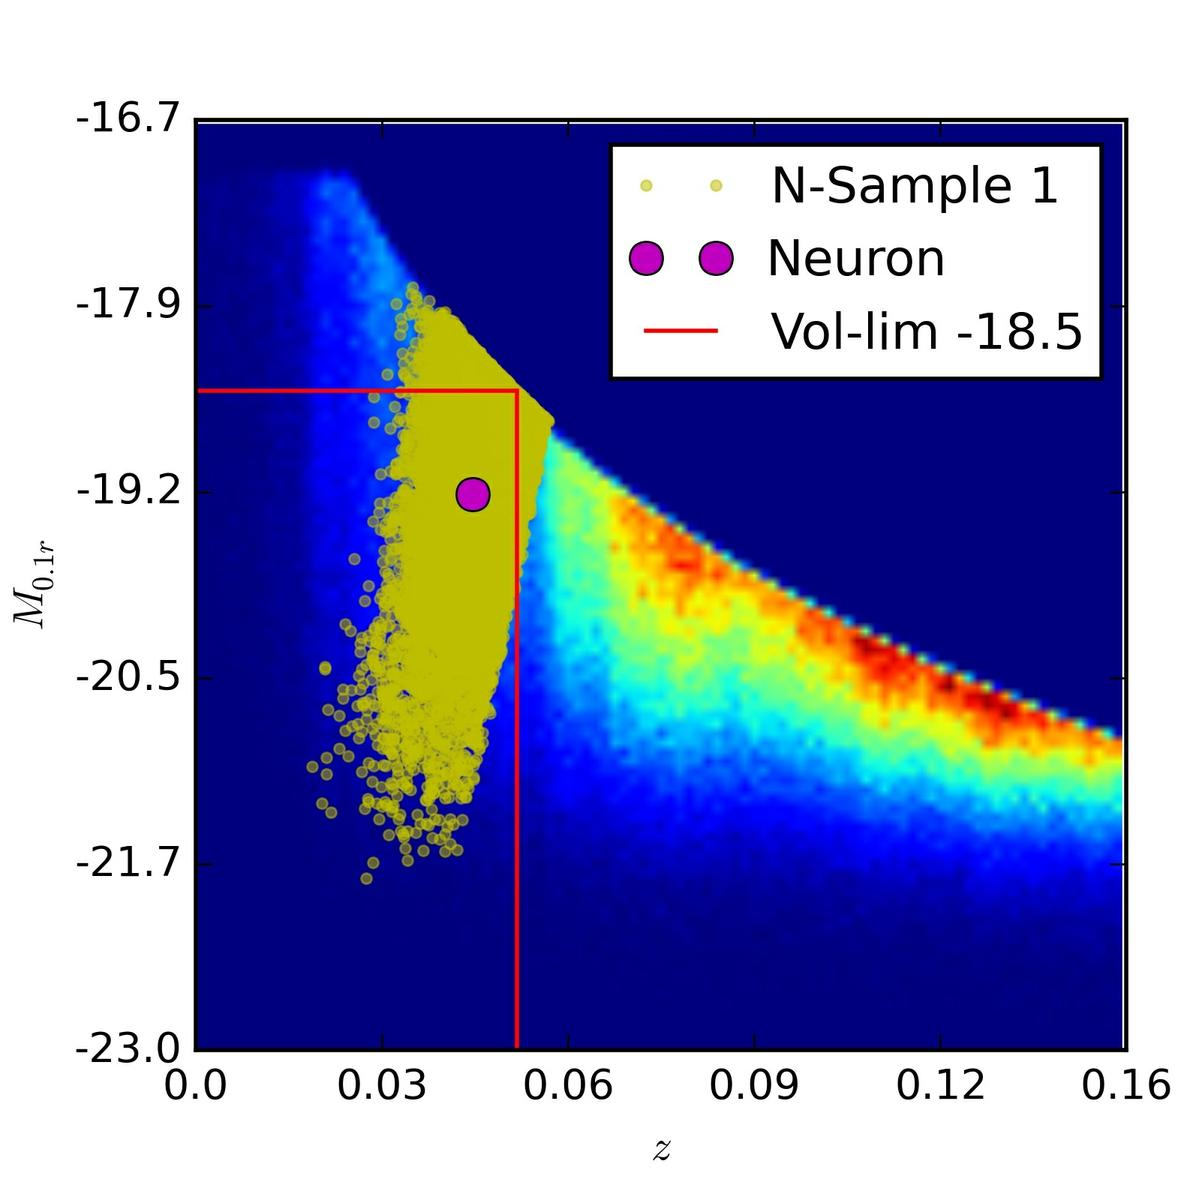
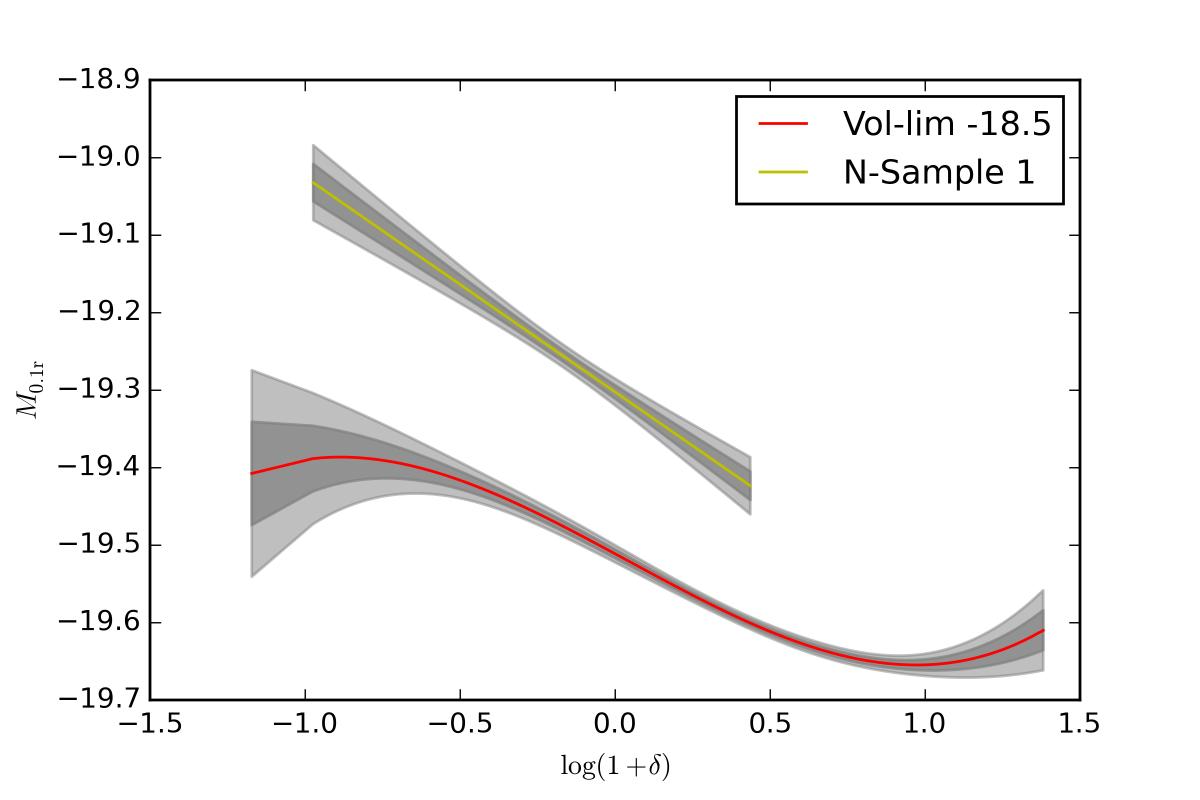
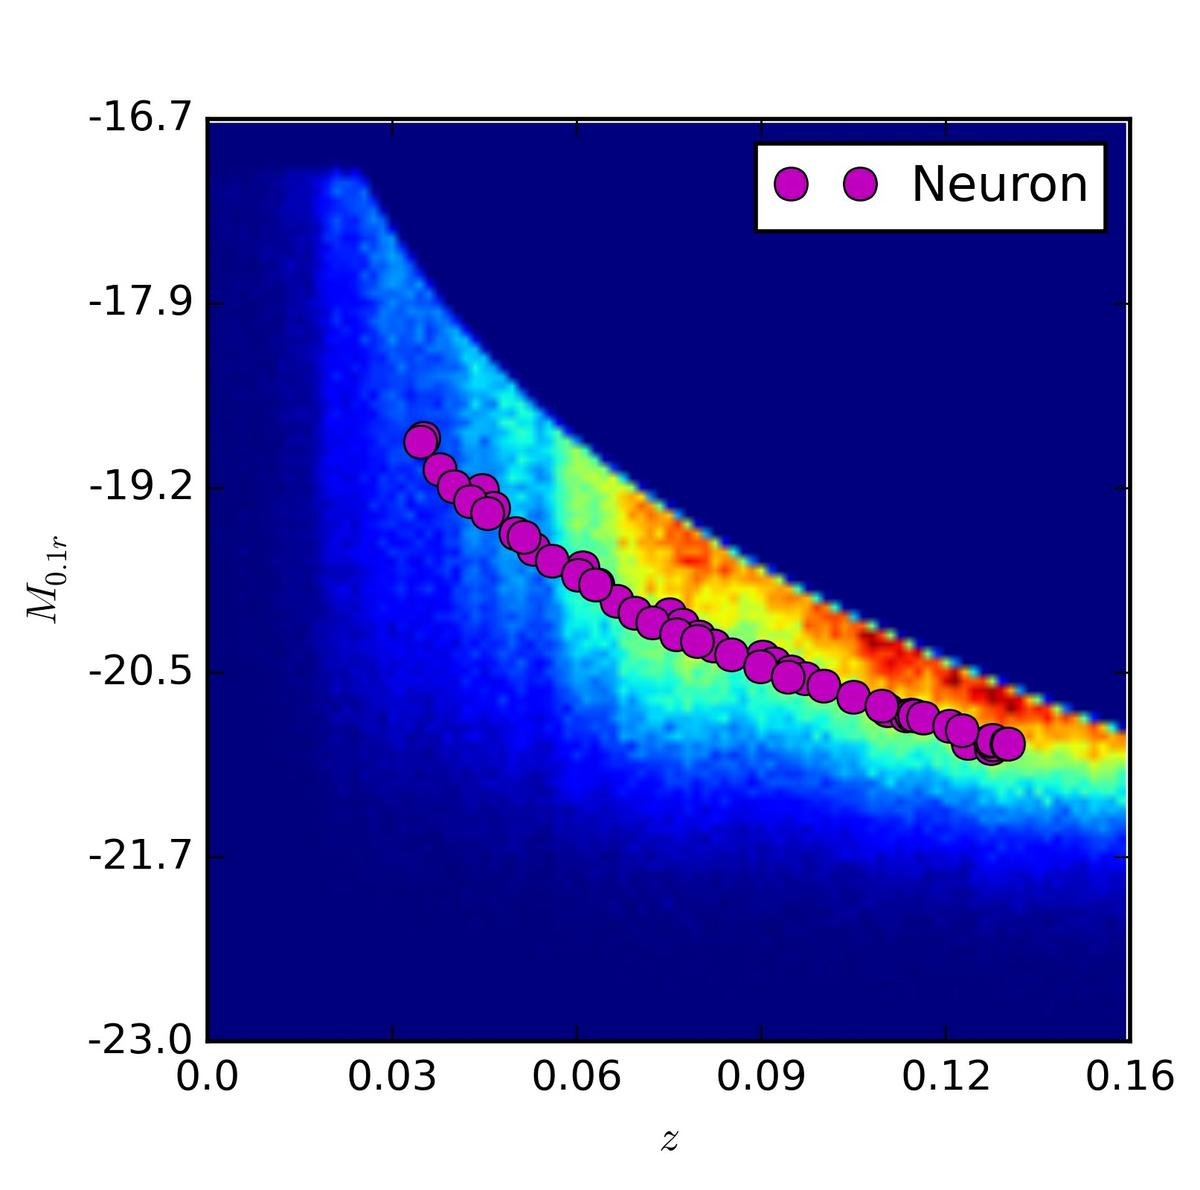
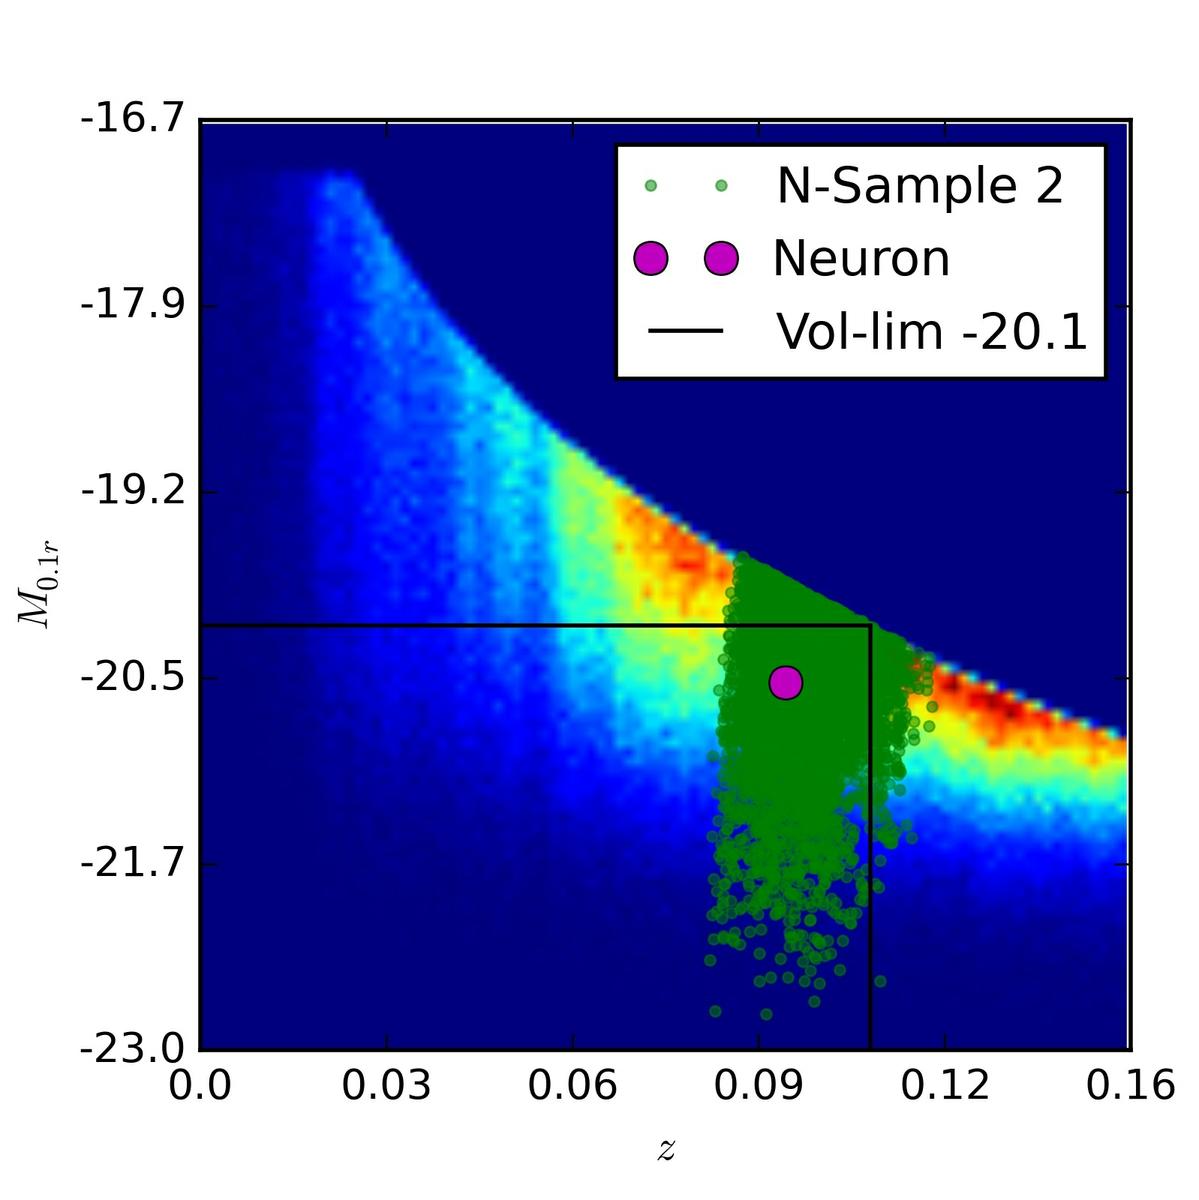
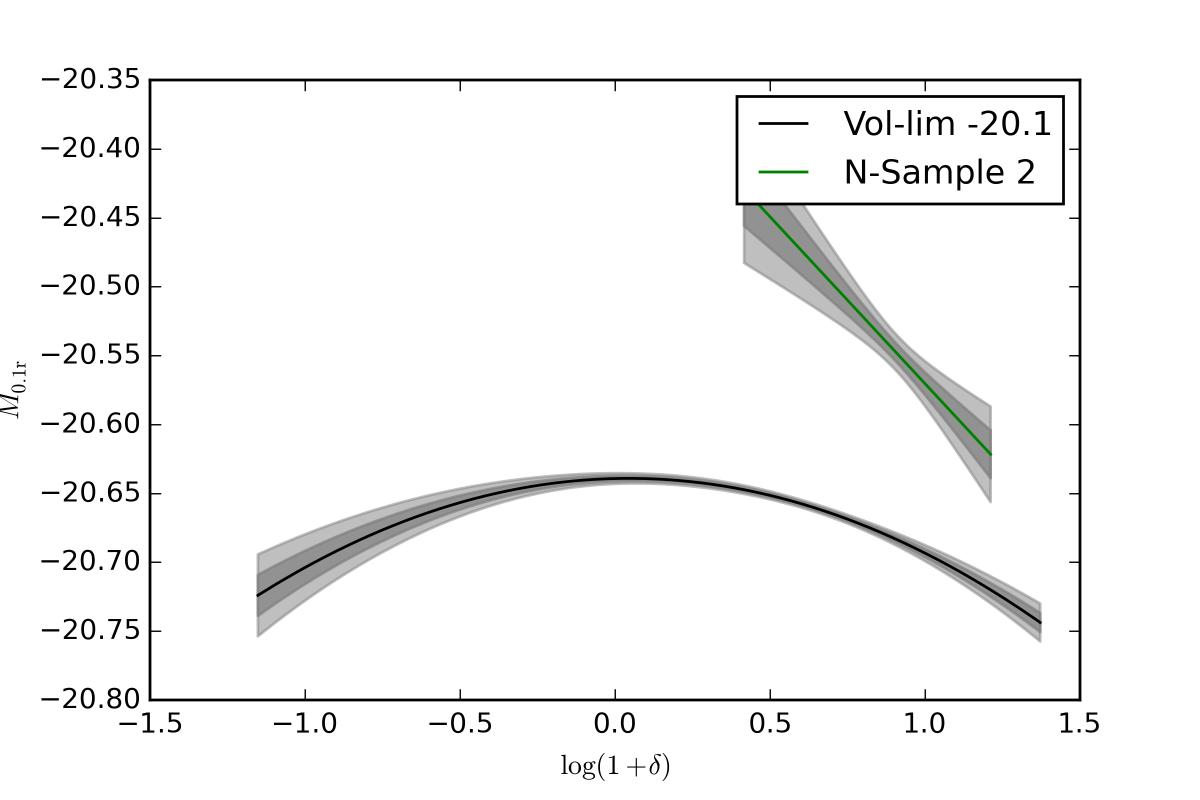
Fig. 7
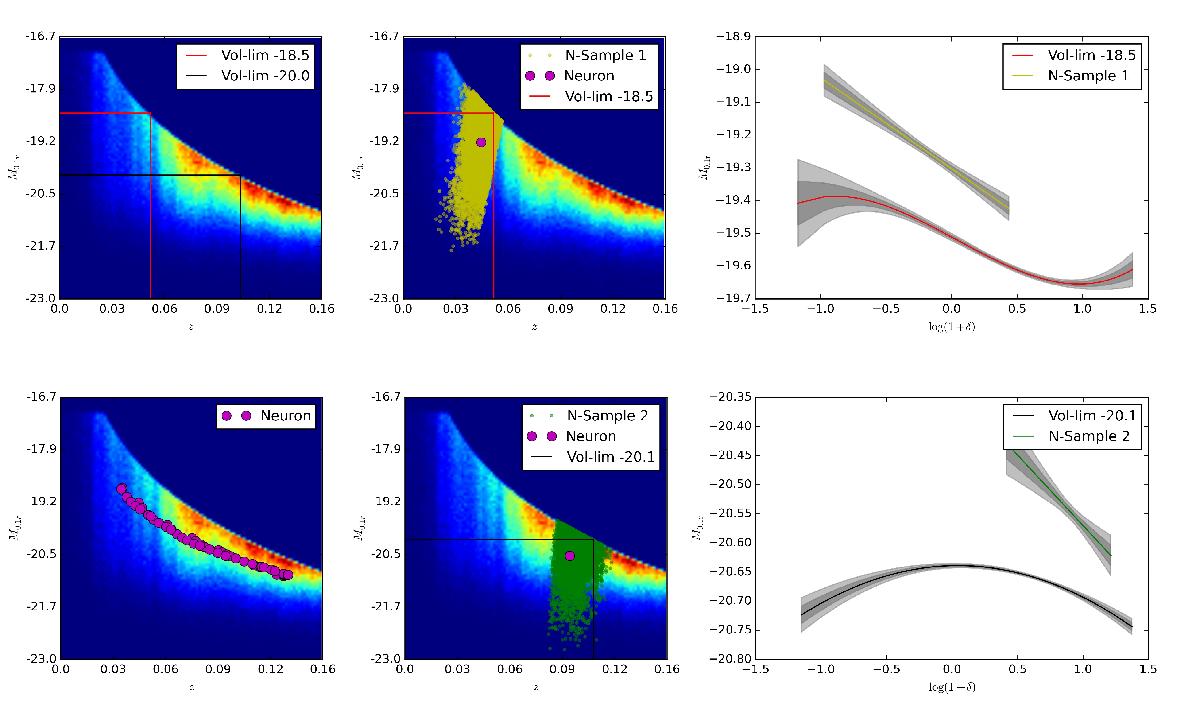
Distribution of the SDSS data projected to the M0.1r-z-plane. The top-left panel shows the volume limitation for different absolute magnitude thresholds (− 18.5, − 20.0). The bottom-left panel shows the distribution of the neurons after a successful application of the SOM to the SDSS data. The top-mid and bottom-mid panels show two different neuron-samples (N-Samples) corresponding to the depicted neurons from the trained SOM. In addition, the volume limitation used for the correlation comparison are depicted in both panels. The selected neurons hold sub-samples of data with a similar projected distribution compared to the volume-limited samples in order to compare the selection methods. The top- and bottom-right panels show reconstructed correlation functions for the volume limited sample with magnitude limits at − 18.5 (top) and − 20.1 (bottom) and for the corresponding neuron-samples. The range of each sub-sample in log (1 + δ) is indicated by the length of each reconstructed polynomial.
Current usage metrics show cumulative count of Article Views (full-text article views including HTML views, PDF and ePub downloads, according to the available data) and Abstracts Views on Vision4Press platform.
Data correspond to usage on the plateform after 2015. The current usage metrics is available 48-96 hours after online publication and is updated daily on week days.
Initial download of the metrics may take a while.