Fig. 5
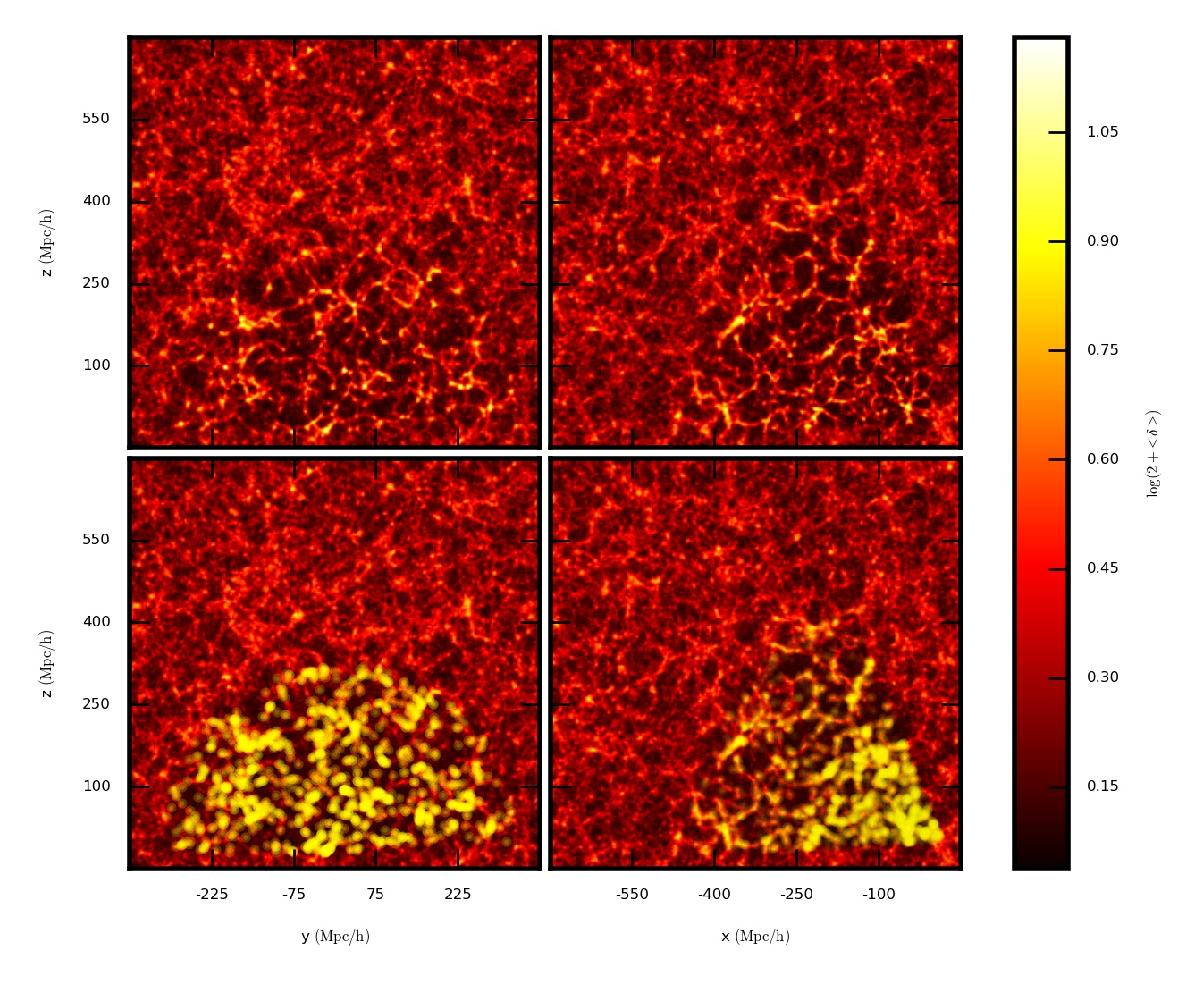
Slices of the ensemble mean density field on a logarithmic scale log (2 + ⟨δ⟩) (upper panels) and the same slices with the SDSS galaxies mapped onto the grid as yellow dots (lower panels). In order to exclude areas of high uncertainty from the analysis we took a distance threshold in the co-moving frame at dlim ≈ 450 Mpc h-1. Therefore galaxies above this limit are excluded form the analysis and not depicted.
Current usage metrics show cumulative count of Article Views (full-text article views including HTML views, PDF and ePub downloads, according to the available data) and Abstracts Views on Vision4Press platform.
Data correspond to usage on the plateform after 2015. The current usage metrics is available 48-96 hours after online publication and is updated daily on week days.
Initial download of the metrics may take a while.