Fig. 3
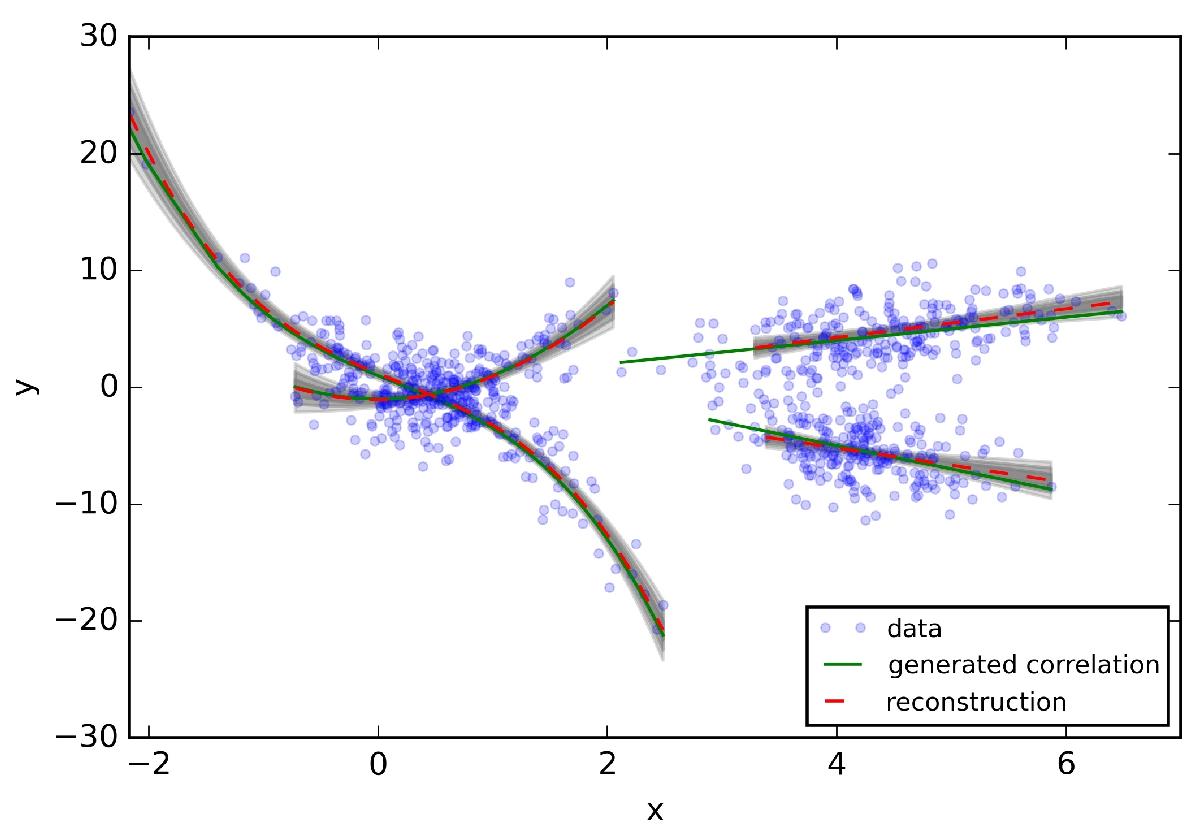
Mock data distribution projected to the x-y-plane as well as the initial correlation functions of each sub-sample of data. In addition, the reconstructed polynomials for each neuron-sample as selected after training are depicted as red dashed lines in the picture. The gray areas denote the 1, 2 and 3σy uncertainties of the reconstruction, respectively. σy is the projection of the parameter covariance D to the data space as described by Eq. (13).
Current usage metrics show cumulative count of Article Views (full-text article views including HTML views, PDF and ePub downloads, according to the available data) and Abstracts Views on Vision4Press platform.
Data correspond to usage on the plateform after 2015. The current usage metrics is available 48-96 hours after online publication and is updated daily on week days.
Initial download of the metrics may take a while.