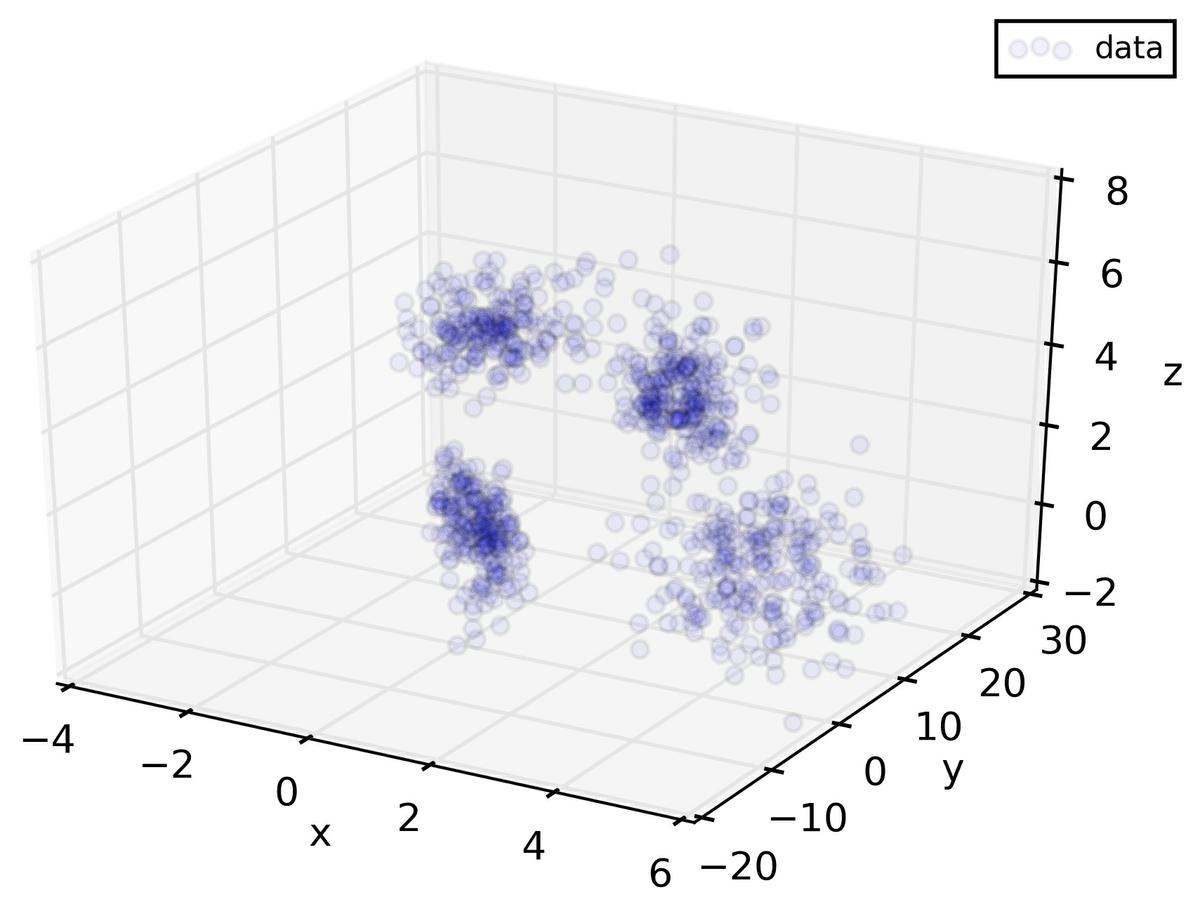
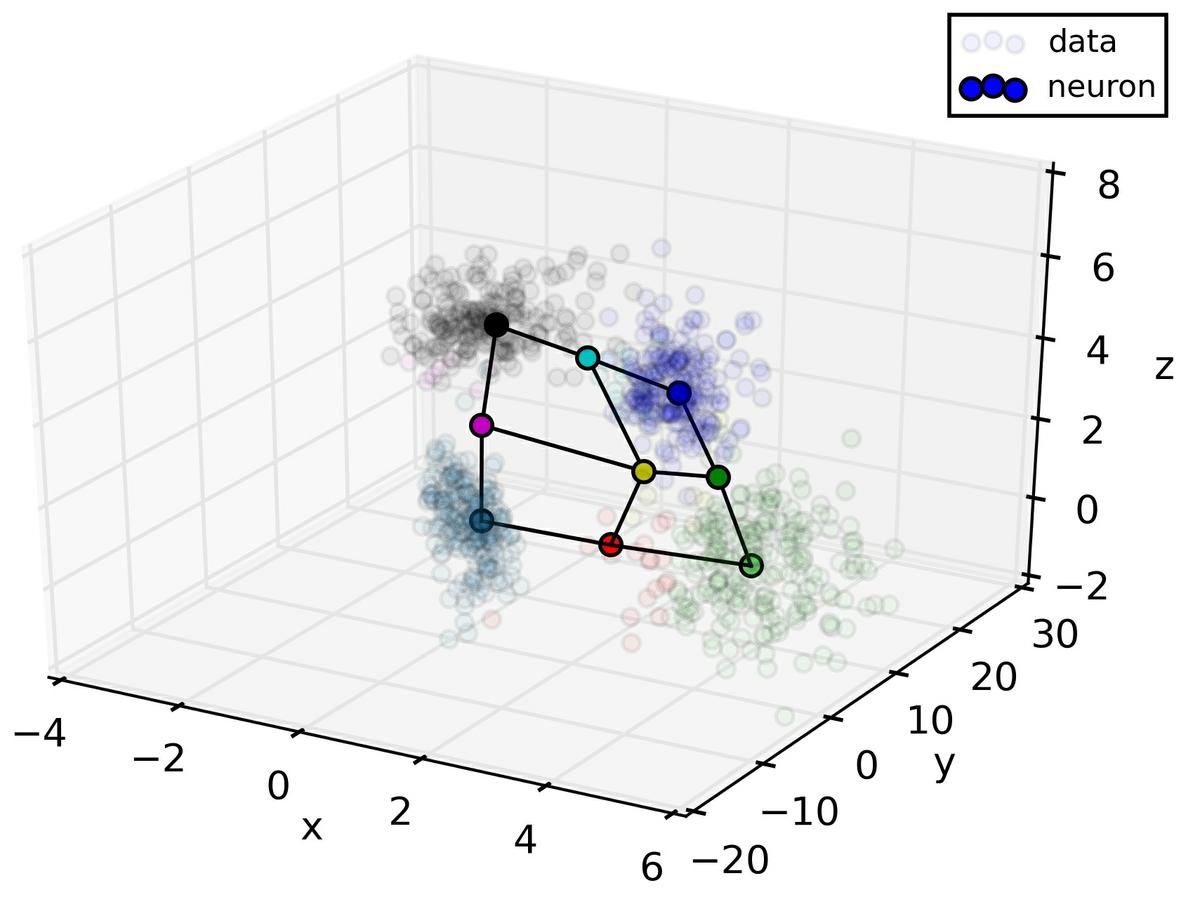
Fig. 2
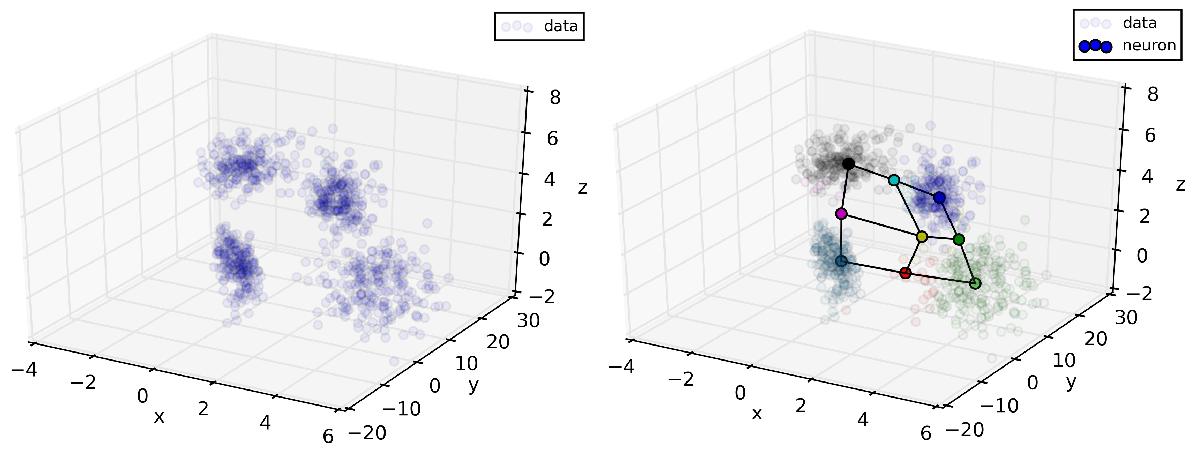
Distribution of the mock data (left panel), generated as described in Sect. 2.3. The x and z coordinates for each data point are drawn from four different Gaussian distributions with different means and covariances. The covariance is assumed to be diagonal. The y coordinates are generated to be correlated with the x coordinates with a correlation function consistent with Eq. (2)(see Table 1 for the correlation coefficients). The right panel shows the data space including the 3 × 3 square lattice neuron pattern after a successful training of the SOM. Neighboring neurons are interlinked in the picture. In addition, each sub-sample of data corresponding to one neuron, is drawn in the color of the specific neuron.
Current usage metrics show cumulative count of Article Views (full-text article views including HTML views, PDF and ePub downloads, according to the available data) and Abstracts Views on Vision4Press platform.
Data correspond to usage on the plateform after 2015. The current usage metrics is available 48-96 hours after online publication and is updated daily on week days.
Initial download of the metrics may take a while.