Fig. 1
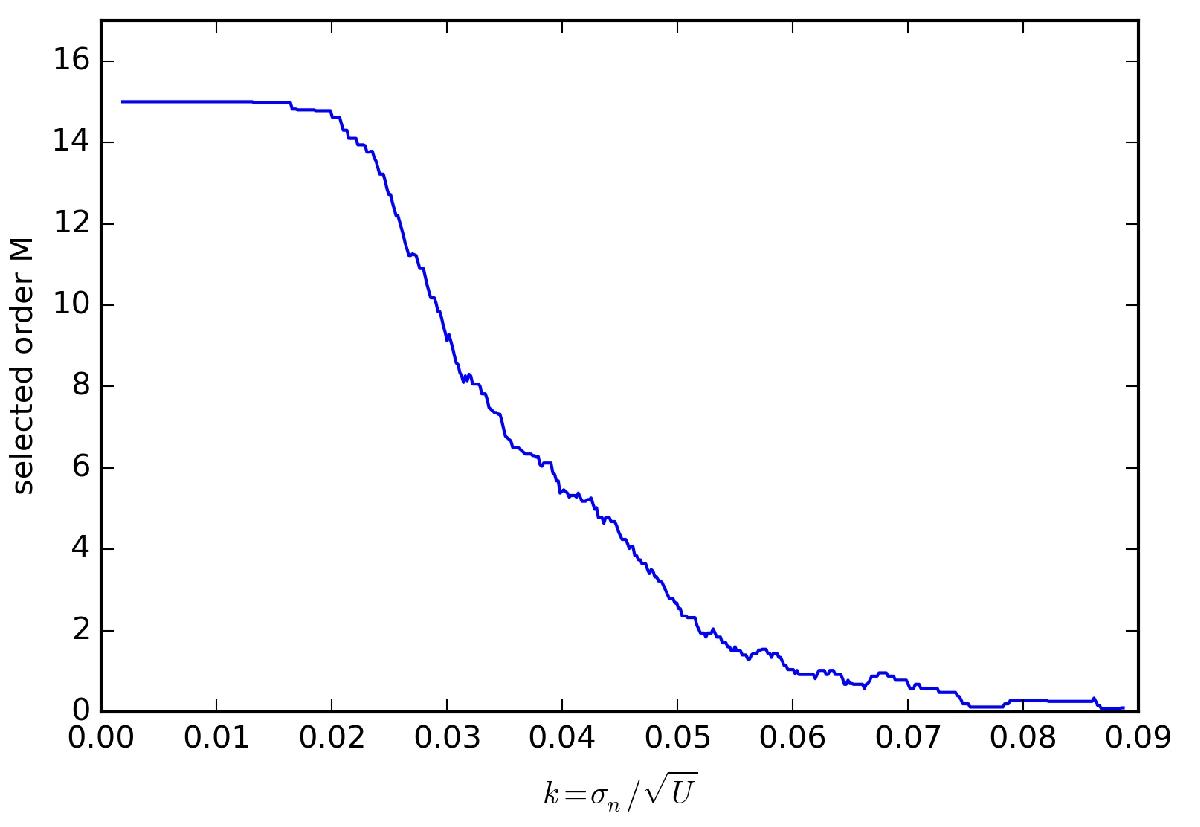
Histogram of recovered polynomial order for different inverse signal to noise ratios k. U = 1000 and denotes the sample size. The noise variance σn ranges from ≈0 to ≤3. The signal was generated according to Eq. (2)as a 15th order polynomial. We see that the most adequate order selected by the BIC decreases with increasing k. The selected model depends on the specific data realization, therefore we averaged over reconstructed orders with similar k
Current usage metrics show cumulative count of Article Views (full-text article views including HTML views, PDF and ePub downloads, according to the available data) and Abstracts Views on Vision4Press platform.
Data correspond to usage on the plateform after 2015. The current usage metrics is available 48-96 hours after online publication and is updated daily on week days.
Initial download of the metrics may take a while.