Fig. 3
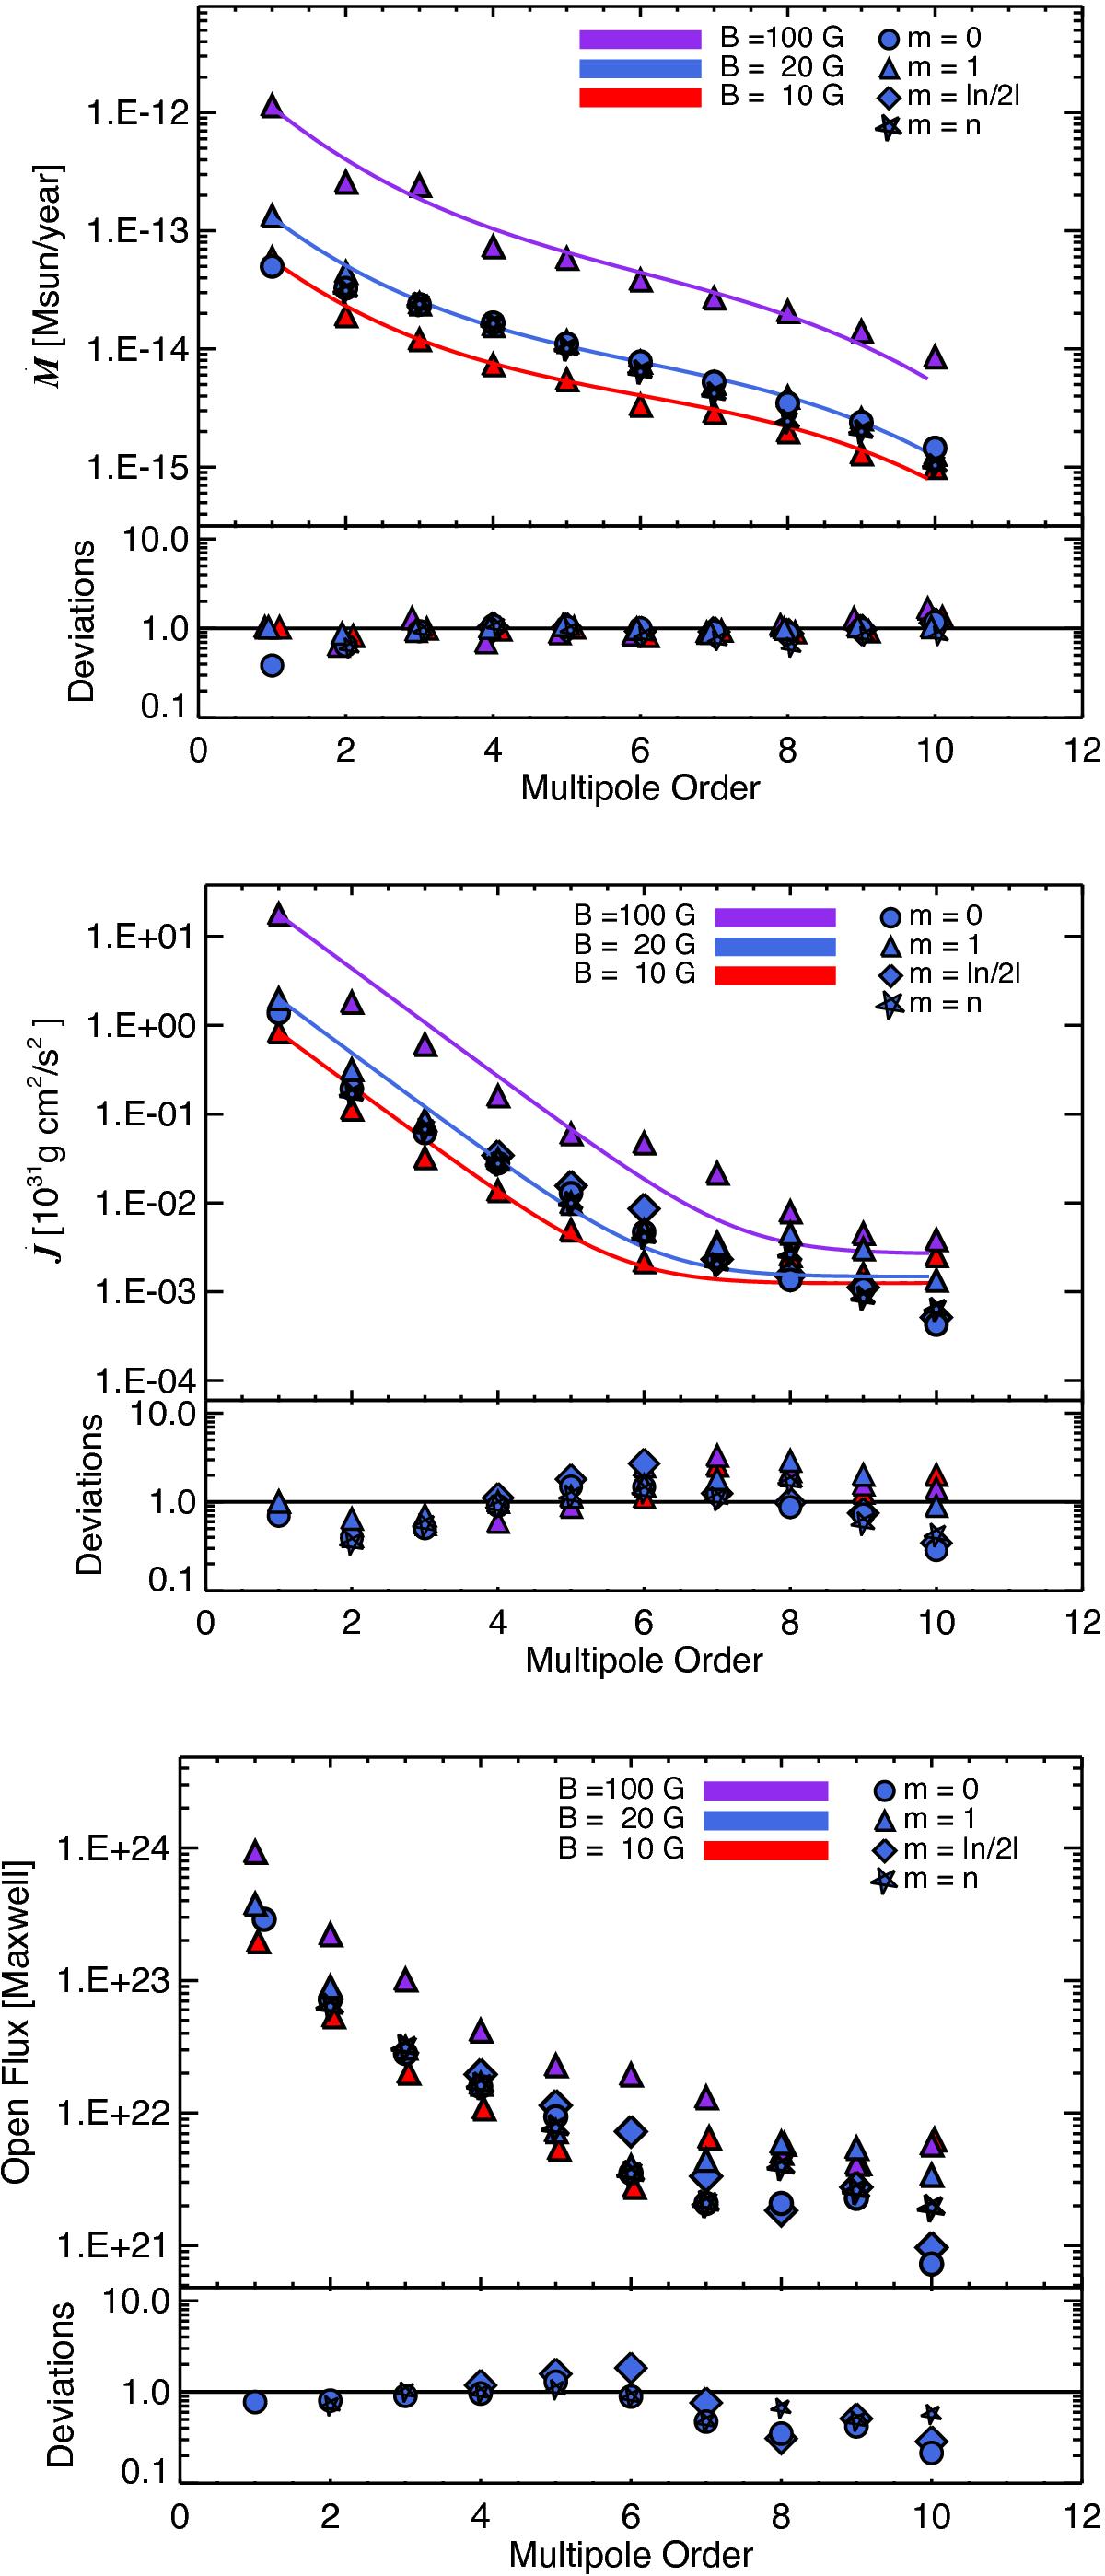
Mass (Ṁtop), angular momentum (![]() middle) loss rates, and open flux (bottom) for different levels of complexity n (x-axis), different field strengths (10 G in red, 20 G in blue, and 100 G in cyan), and different distributions of magnetic flux with different symbols (only for the 20 G case). The smooth curves are the analytical relations derived in Sect. 3.2. The bottom plot in the two top panels shows the logarithmic deviations of the simulations over the analytical curves, while the bottom panel shows the logarithmic difference between the open flux of the m = 1 case and the rest, with the same symbols and colors.
middle) loss rates, and open flux (bottom) for different levels of complexity n (x-axis), different field strengths (10 G in red, 20 G in blue, and 100 G in cyan), and different distributions of magnetic flux with different symbols (only for the 20 G case). The smooth curves are the analytical relations derived in Sect. 3.2. The bottom plot in the two top panels shows the logarithmic deviations of the simulations over the analytical curves, while the bottom panel shows the logarithmic difference between the open flux of the m = 1 case and the rest, with the same symbols and colors.
Current usage metrics show cumulative count of Article Views (full-text article views including HTML views, PDF and ePub downloads, according to the available data) and Abstracts Views on Vision4Press platform.
Data correspond to usage on the plateform after 2015. The current usage metrics is available 48-96 hours after online publication and is updated daily on week days.
Initial download of the metrics may take a while.