Fig. 1
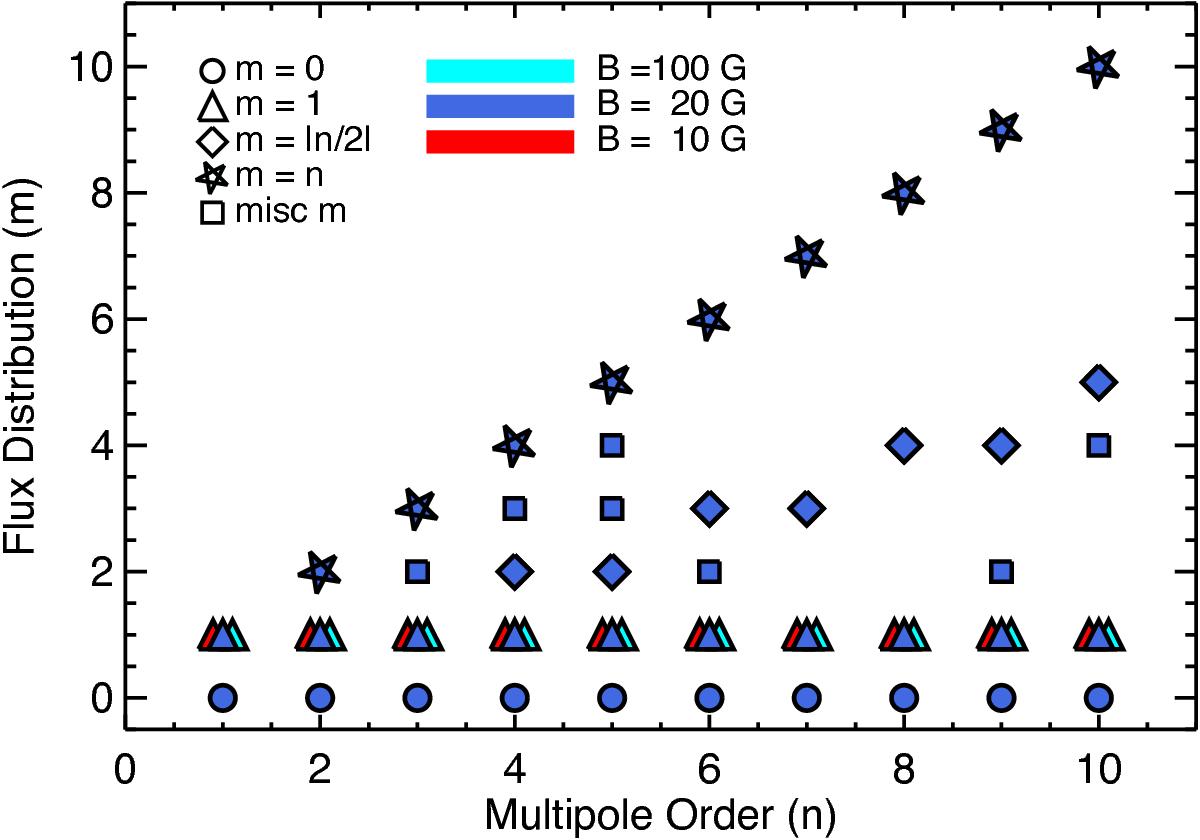
Grid of simulations of magnetic multipole moment n (x-axis) and flux distribution m (y-axis). The m = 1 case for all ns are taken from CG15. The 33 new cases are illustrated with circles for m = 0, diamonds for m = | n/ 2 |, stars for m = n, and squares represent other values of m. All the new cases are assuming a magnetic field strength of 20 G.
Current usage metrics show cumulative count of Article Views (full-text article views including HTML views, PDF and ePub downloads, according to the available data) and Abstracts Views on Vision4Press platform.
Data correspond to usage on the plateform after 2015. The current usage metrics is available 48-96 hours after online publication and is updated daily on week days.
Initial download of the metrics may take a while.