Free Access
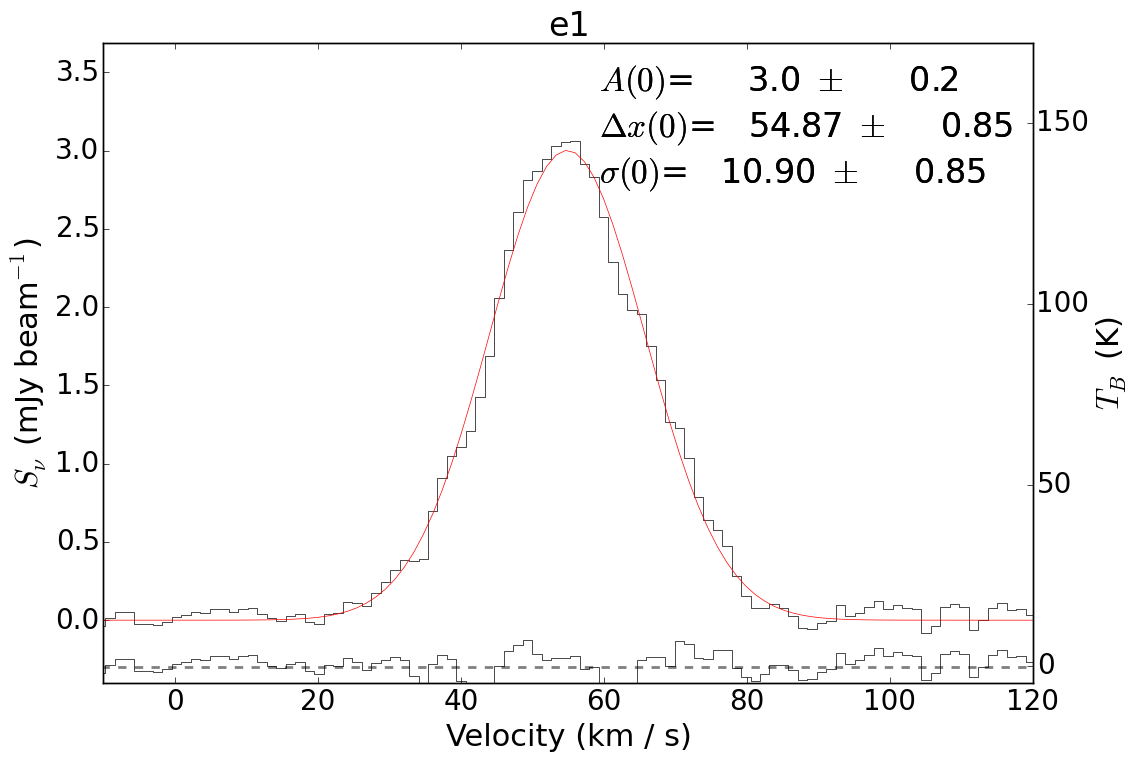
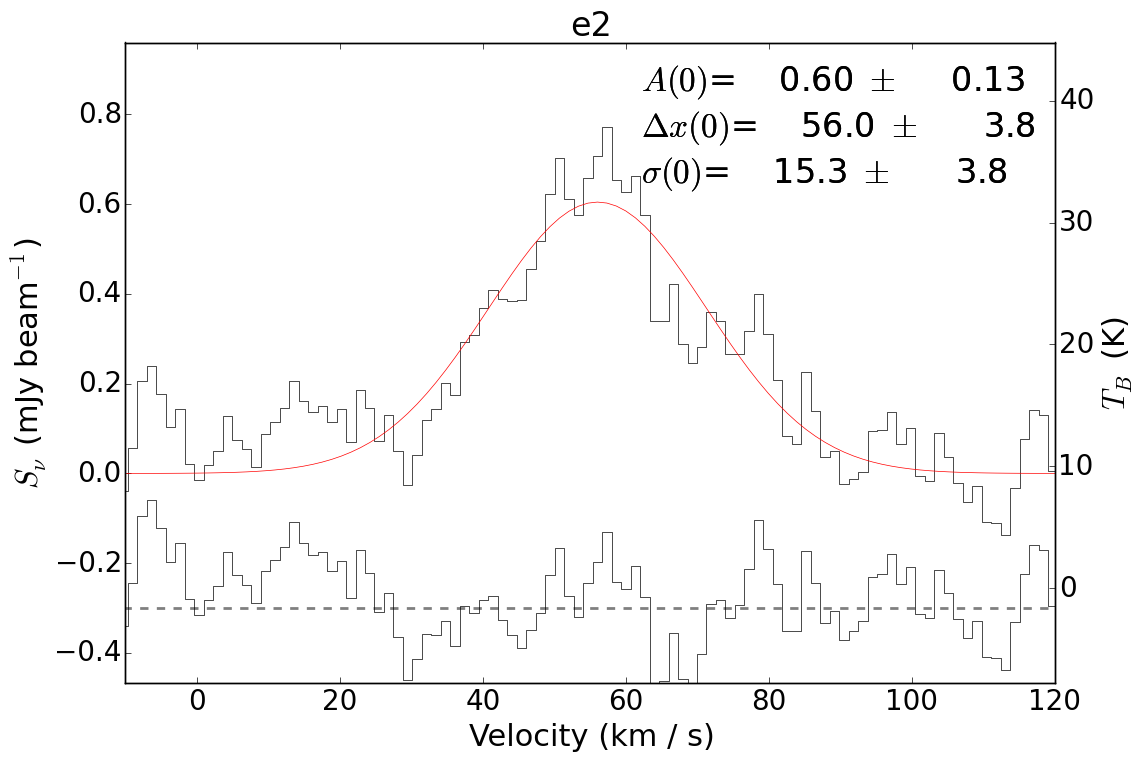
Fig. 19

H77α spectra of W51e1 and W51e2. These velocities are used in conjunction with the H2CO emission fits to determine the velocity dispersion in Sect. 4.5. The red curve shows the fit. The lower spectrum shows the fit residual, with the dashed line indicating the zero level.
This figure is made of several images, please see below:
Current usage metrics show cumulative count of Article Views (full-text article views including HTML views, PDF and ePub downloads, according to the available data) and Abstracts Views on Vision4Press platform.
Data correspond to usage on the plateform after 2015. The current usage metrics is available 48-96 hours after online publication and is updated daily on week days.
Initial download of the metrics may take a while.