Fig. 18
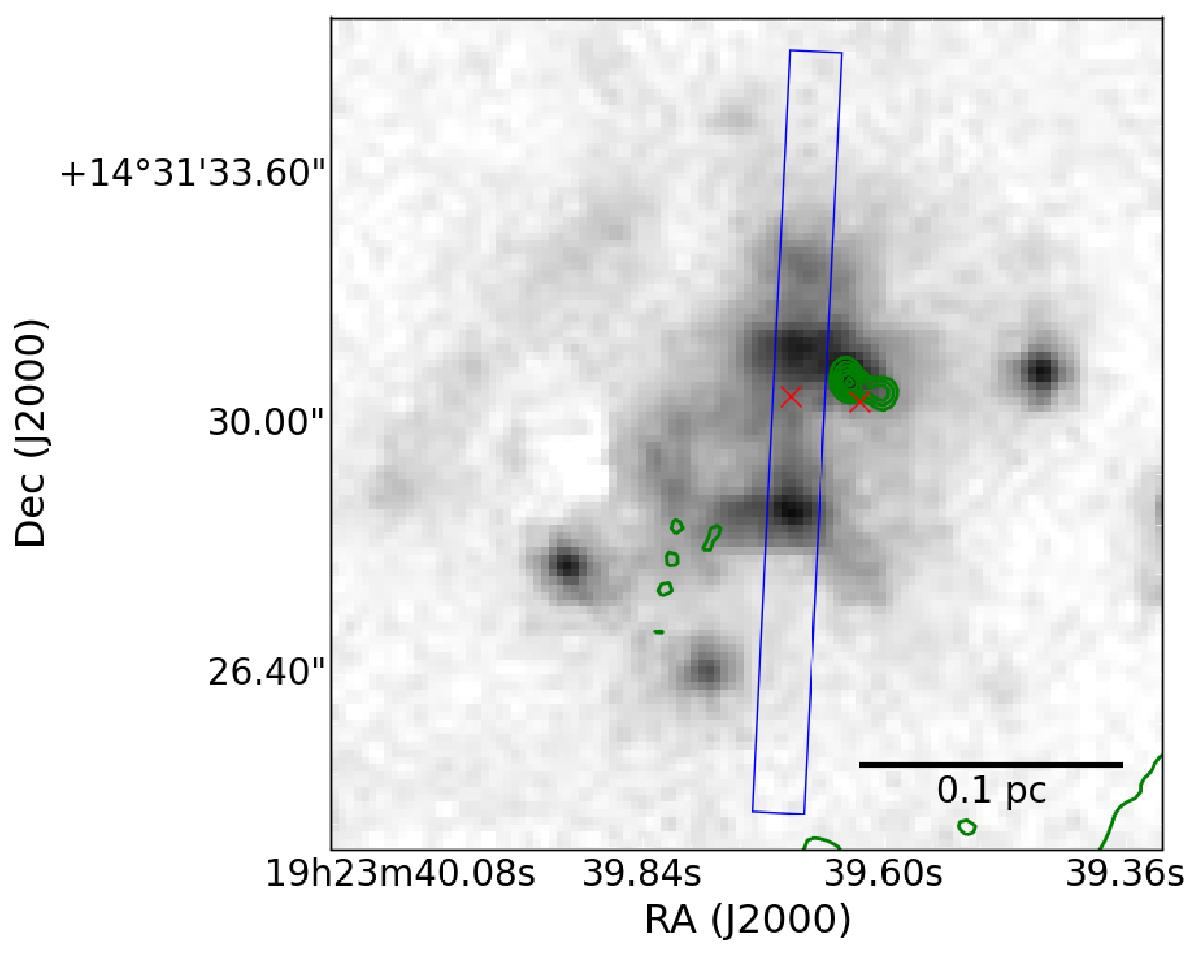
A UWISH2 H2 image with Ku-band contours of sources d4e and d4w overlaid at 0.15, 0.30, 0.45, 0.60, 0.75, and 0.90 mJy/beam. The box shows the slit position used in Hodapp & Davis (2002), in which [Fe II] emission spanning >200 km s-1 was detected. The X’s mark positions of MOXC X-ray sources (Townsley et al. 2014). Both radio sources are considered associated with the closer MOXC source in Table 8. This figure is discussed in Sect. 4.4.
Current usage metrics show cumulative count of Article Views (full-text article views including HTML views, PDF and ePub downloads, according to the available data) and Abstracts Views on Vision4Press platform.
Data correspond to usage on the plateform after 2015. The current usage metrics is available 48-96 hours after online publication and is updated daily on week days.
Initial download of the metrics may take a while.