Free Access
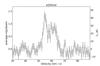
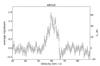
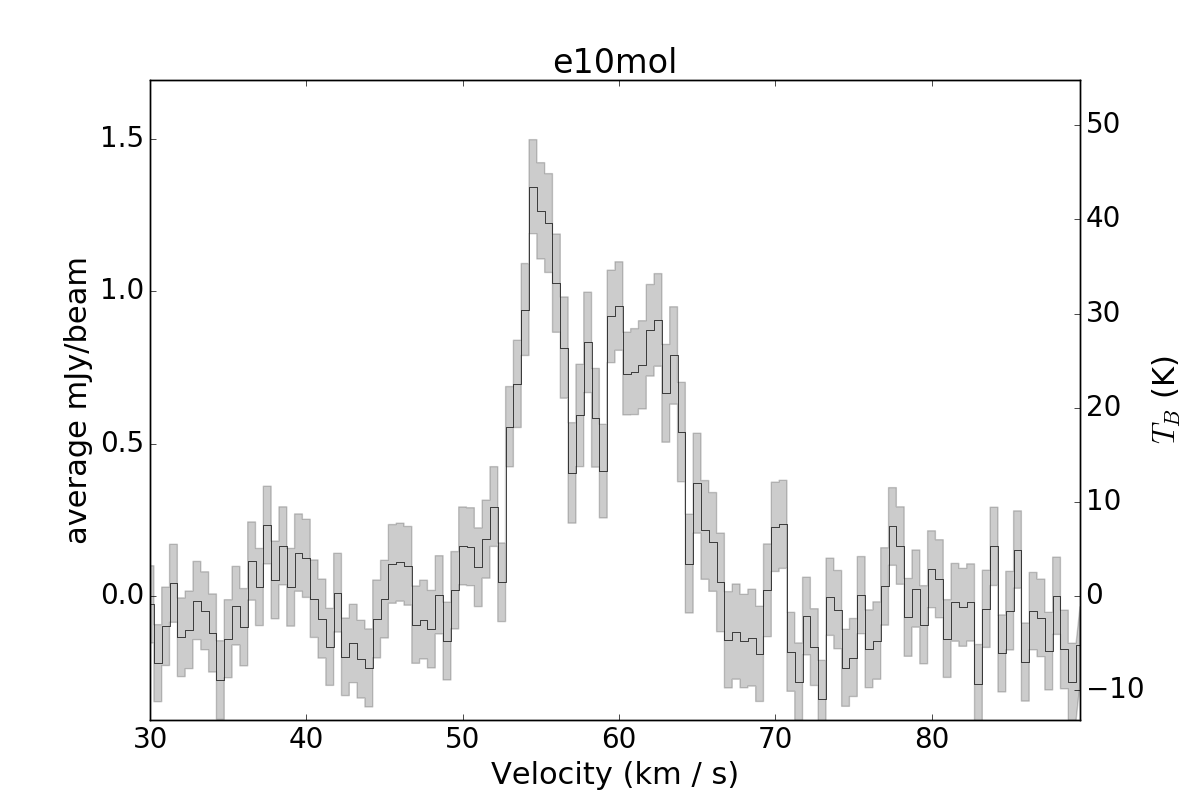
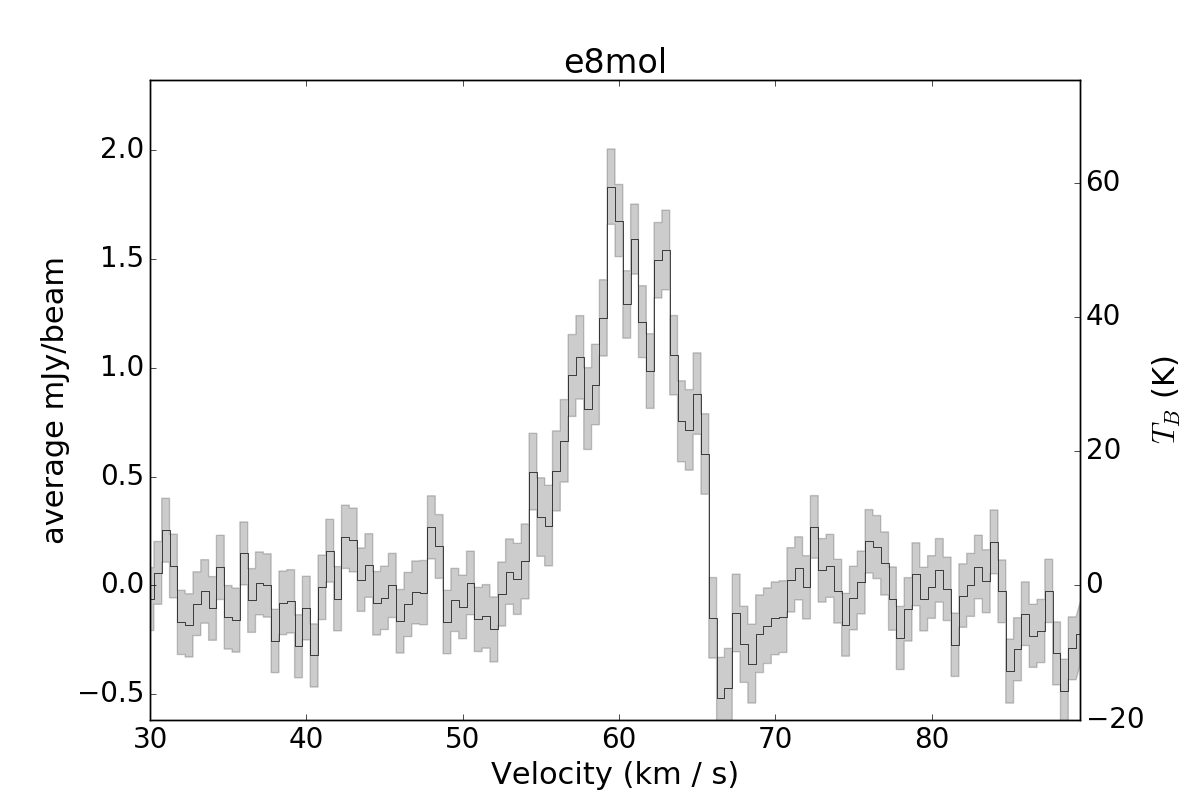
Fig. 17

Spectra of the 21,1−21,2 emission around W51e1. See Fig. 14 to see where these were extracted. The left axis shows the average brightness over the aperture in mJy/beam, while the right axis shows the brightness temperature.
This figure is made of several images, please see below:
Current usage metrics show cumulative count of Article Views (full-text article views including HTML views, PDF and ePub downloads, according to the available data) and Abstracts Views on Vision4Press platform.
Data correspond to usage on the plateform after 2015. The current usage metrics is available 48-96 hours after online publication and is updated daily on week days.
Initial download of the metrics may take a while.