Fig. A.1
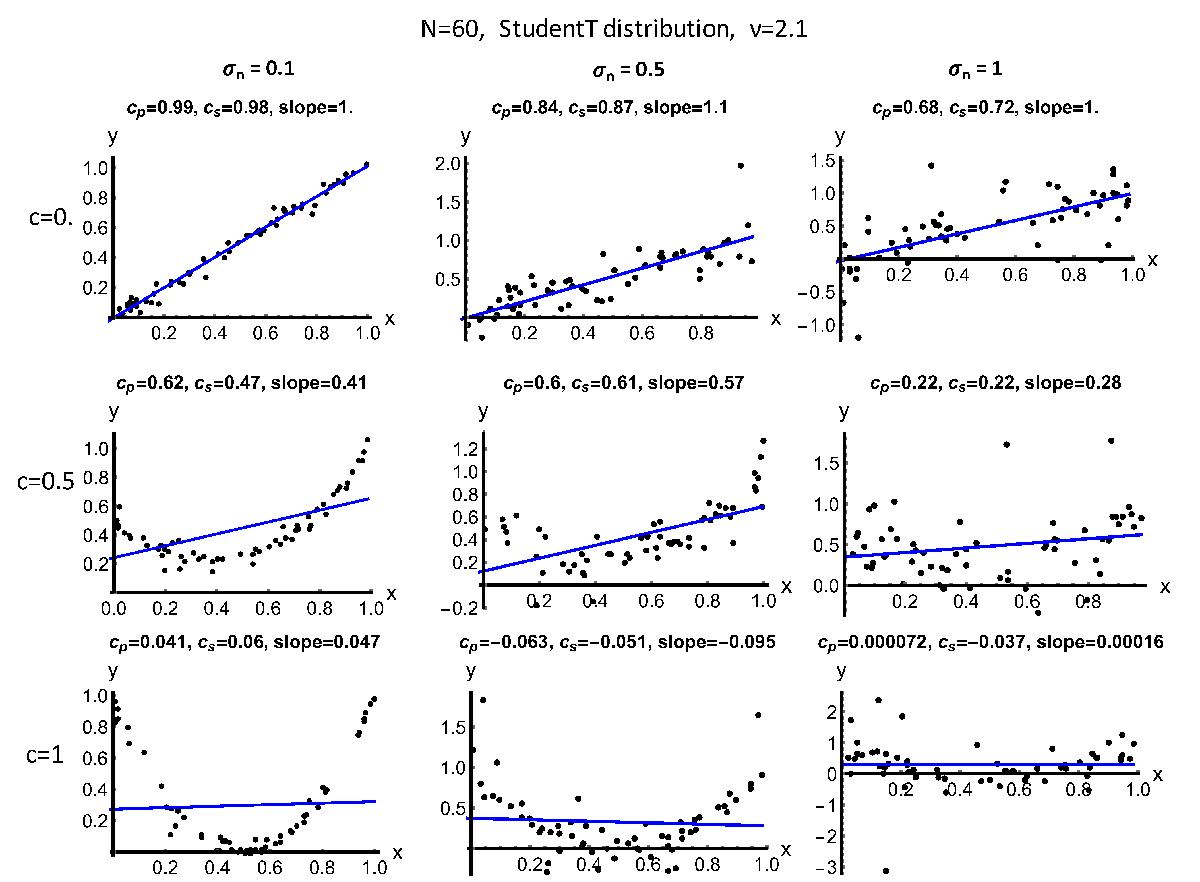
Examples for the three cases c = 0,0.5,1 (from top to bottom) of Eq. (A.1) with the added noise with the StudentT distribution (ν = 2.1) and for three levels of noise (standard deviation σn = 0.1,0.5,1from left to right column). In each panel N = 60 points are selected with a different random seed. The blue straight line is the least-squares fit to the simulated points (in black). The correlation coefficients and the slope of the fitted straight line are written at the top of the panels.
Current usage metrics show cumulative count of Article Views (full-text article views including HTML views, PDF and ePub downloads, according to the available data) and Abstracts Views on Vision4Press platform.
Data correspond to usage on the plateform after 2015. The current usage metrics is available 48-96 hours after online publication and is updated daily on week days.
Initial download of the metrics may take a while.