Fig. 9
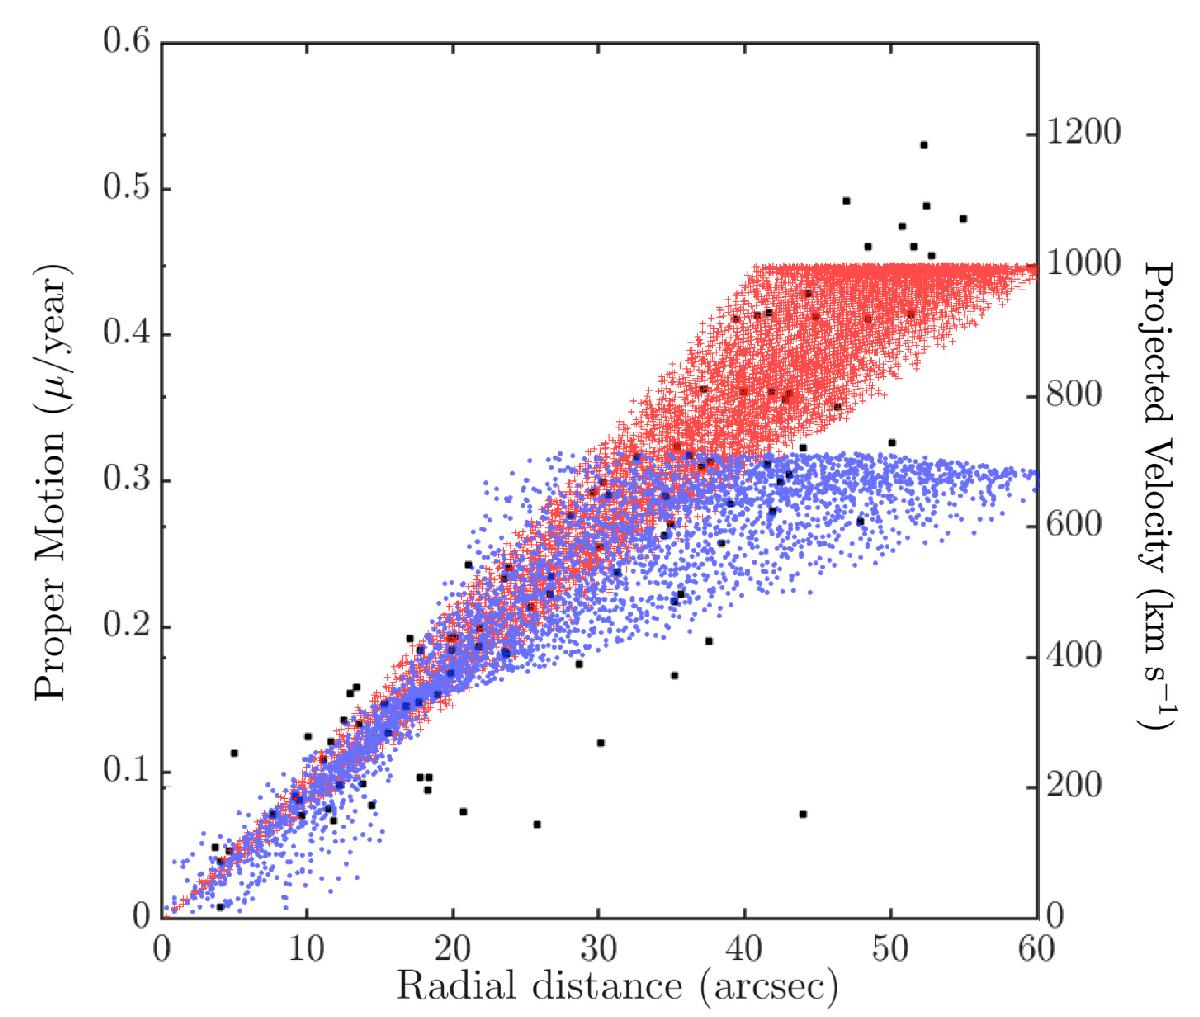
Fit of the model presented here to the proper motion versus radial distance. The filled black squares are proper motion measurements from the online data table of L12 in terms of radial distance. The deviation from pure radial expansion is accounted for by the polar cones (blue overlay). The red corresponds to the cylinder fit to data presented in L12.
Current usage metrics show cumulative count of Article Views (full-text article views including HTML views, PDF and ePub downloads, according to the available data) and Abstracts Views on Vision4Press platform.
Data correspond to usage on the plateform after 2015. The current usage metrics is available 48-96 hours after online publication and is updated daily on week days.
Initial download of the metrics may take a while.