Free Access
Fig. 8
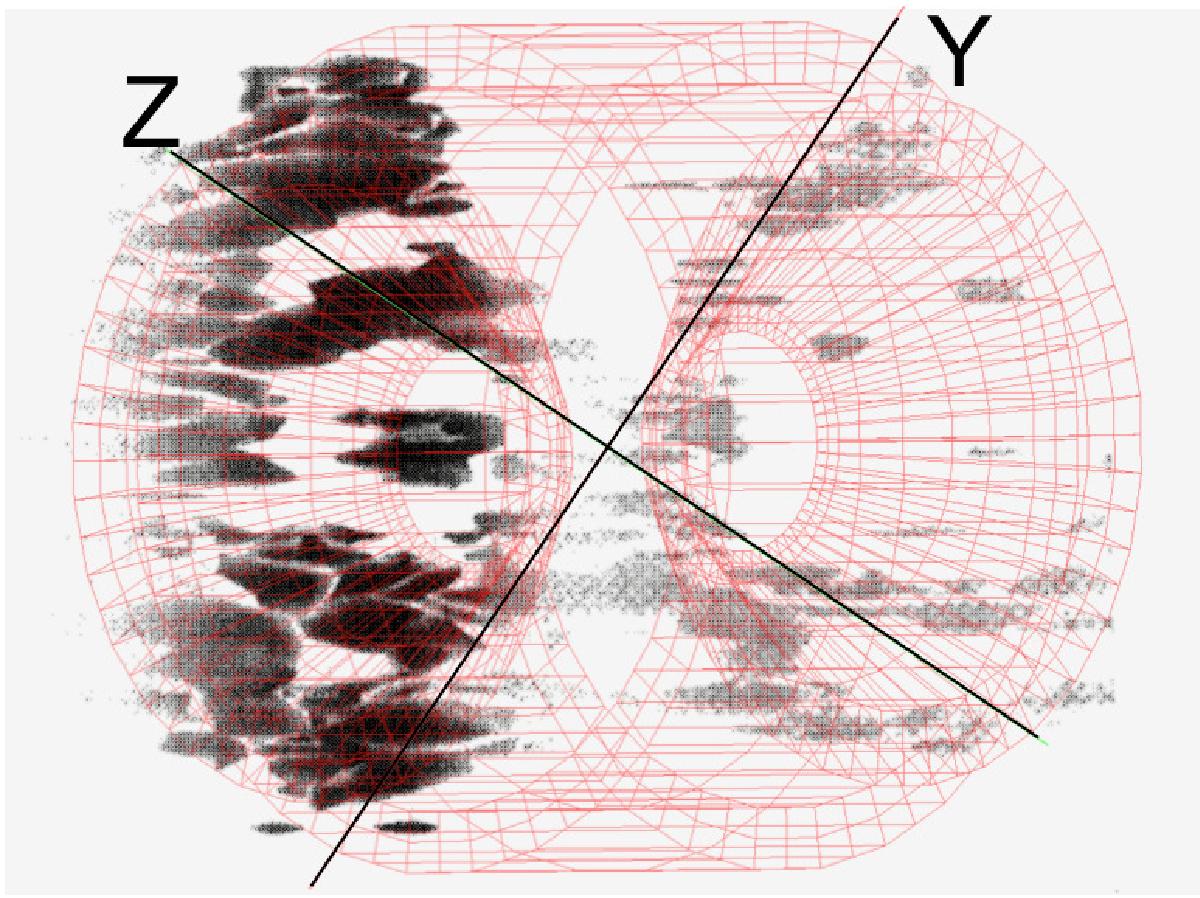
Z cut model presented by Lawrence et al. (1995; greyscale, adapted from their Fig. 6, panel C) with our model overlaid on the observations (the mesh). Here we see the model polar features trace out the morphology well.
Current usage metrics show cumulative count of Article Views (full-text article views including HTML views, PDF and ePub downloads, according to the available data) and Abstracts Views on Vision4Press platform.
Data correspond to usage on the plateform after 2015. The current usage metrics is available 48-96 hours after online publication and is updated daily on week days.
Initial download of the metrics may take a while.