Fig. 7
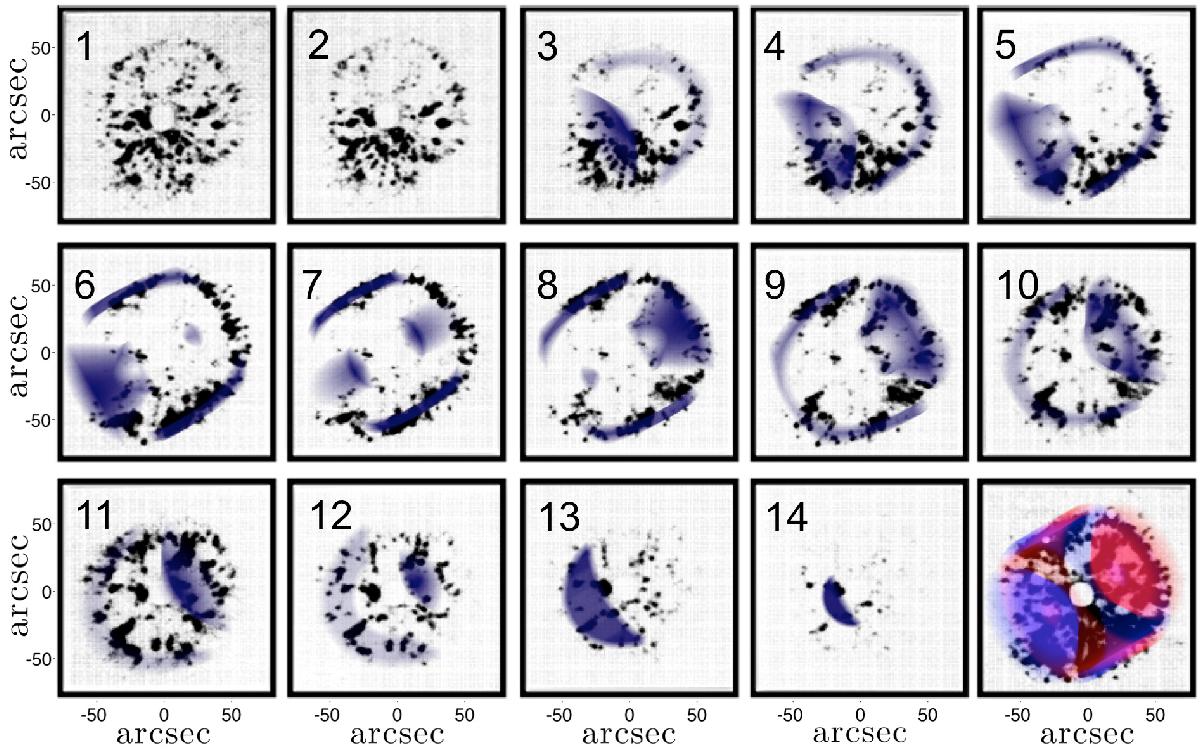
Channel maps from Lawrence et al. (1995) (dots) compared to our scaled morpho-kinematic model (overlaid shadow). Frames 1–14 start at –840 km s-1 and go up to 980 km s-1, the velocities being relative to the [N ii] 6583 Å emission line in steps of 140 km s-1 with a resolution of 240 km s-1. The first four frames have the red side dominated by Hα emission (the first two extremely so and whose shape models have been left out for this reason) and the final frame is a sum of all those previously overlaid with the red-blue model distribution. Influence of the Hα emission is visible in the form of the persistent S/SE feature up to frame 7.
Current usage metrics show cumulative count of Article Views (full-text article views including HTML views, PDF and ePub downloads, according to the available data) and Abstracts Views on Vision4Press platform.
Data correspond to usage on the plateform after 2015. The current usage metrics is available 48-96 hours after online publication and is updated daily on week days.
Initial download of the metrics may take a while.