Fig. 6
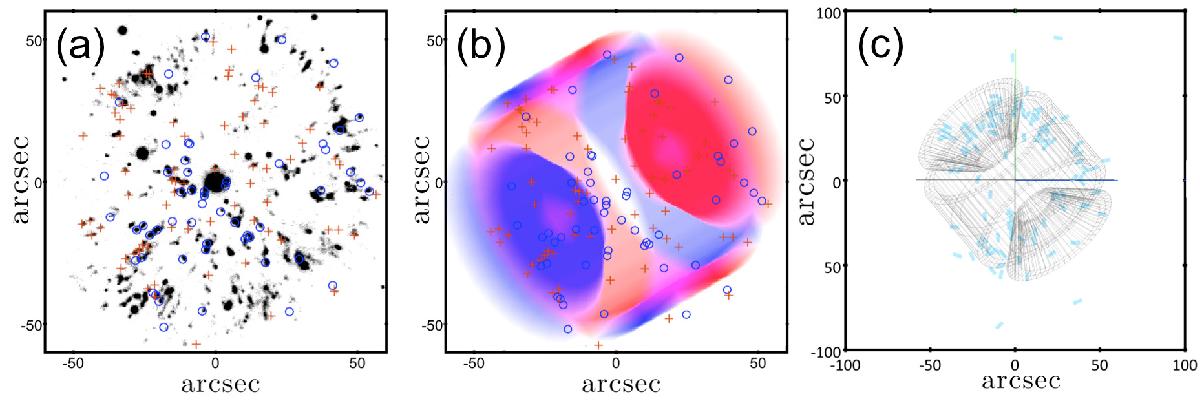
Panel a): red-blue Doppler distribution from observed radial velocities of 148 knots overlaid on an image from the Mayall telescope; north is up and east is to the left. Panel b): fit of the cylinder on the observed radial velocity distribution. Panel c): model fit to the deprojected observations of L12 in the x-z plane. We note the extended ballistic knots and the larger plotted area here.
Current usage metrics show cumulative count of Article Views (full-text article views including HTML views, PDF and ePub downloads, according to the available data) and Abstracts Views on Vision4Press platform.
Data correspond to usage on the plateform after 2015. The current usage metrics is available 48-96 hours after online publication and is updated daily on week days.
Initial download of the metrics may take a while.