Fig. 7
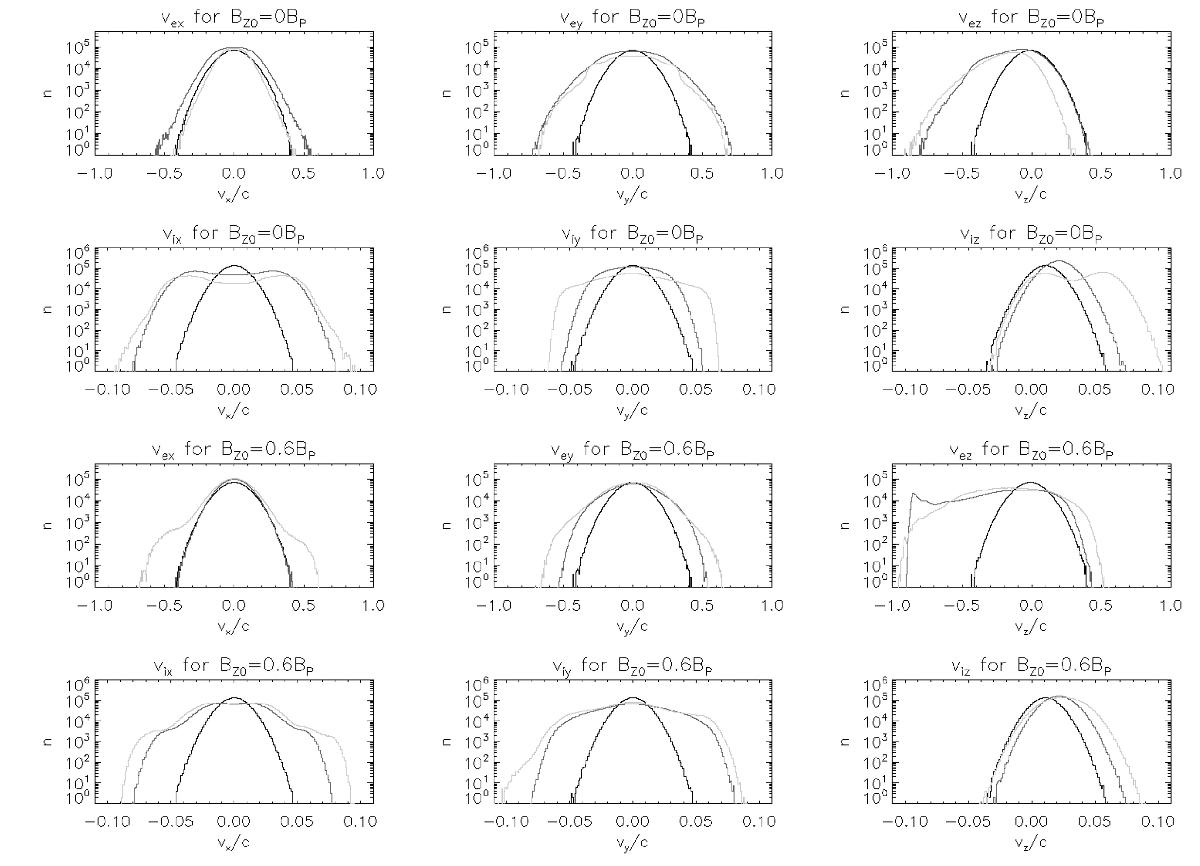
Electron and ion particle velocity distribution functions for guide-field cases of 0BP and 0.6BP in the 2.5D simulation runs. Black lines show the distribution functions at the beginning of the respective simulation. The dark grey lines show the distribution functions at peak reconnection, i.e. t = 250 /ωpe for zero guide-field and 425 /ωpe for the 0.6BP guide-field case. The light grey lines show distribution functions at the end of the simulation, i.e. t = 500 /ωpe. The particles included in the plots were chosen from an area around the diffusion region, i.e. (− 2c/ωpe) <x< (2c/ωpe) and (− 8c/ωpe) <y< (8c/ωpe).
Current usage metrics show cumulative count of Article Views (full-text article views including HTML views, PDF and ePub downloads, according to the available data) and Abstracts Views on Vision4Press platform.
Data correspond to usage on the plateform after 2015. The current usage metrics is available 48-96 hours after online publication and is updated daily on week days.
Initial download of the metrics may take a while.