Fig. 6
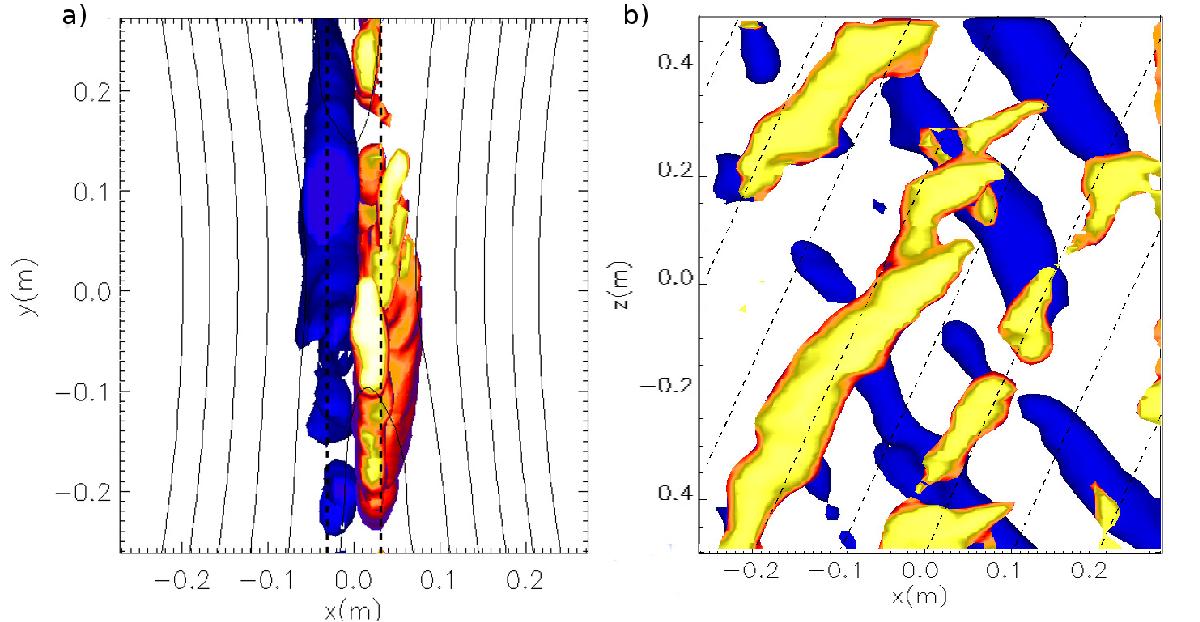
As in Fig. 5 panel f), showing vortical flows in 3D simulation runs with a guide-field of 0.6BP according to the Q-value at t = 387ωpe. Panels use perspectives as indicated by axes. In panel a), the dashed lines signify the distance of vortex tubes from the centre of the domain and thus from the centre of the diffusion region. Dashed lines in panel b) are inclined at the calculated value of θ, based on Eq. (6), and show a strong correspondence with the inclination of vortex tubes.
Current usage metrics show cumulative count of Article Views (full-text article views including HTML views, PDF and ePub downloads, according to the available data) and Abstracts Views on Vision4Press platform.
Data correspond to usage on the plateform after 2015. The current usage metrics is available 48-96 hours after online publication and is updated daily on week days.
Initial download of the metrics may take a while.