Fig. 5
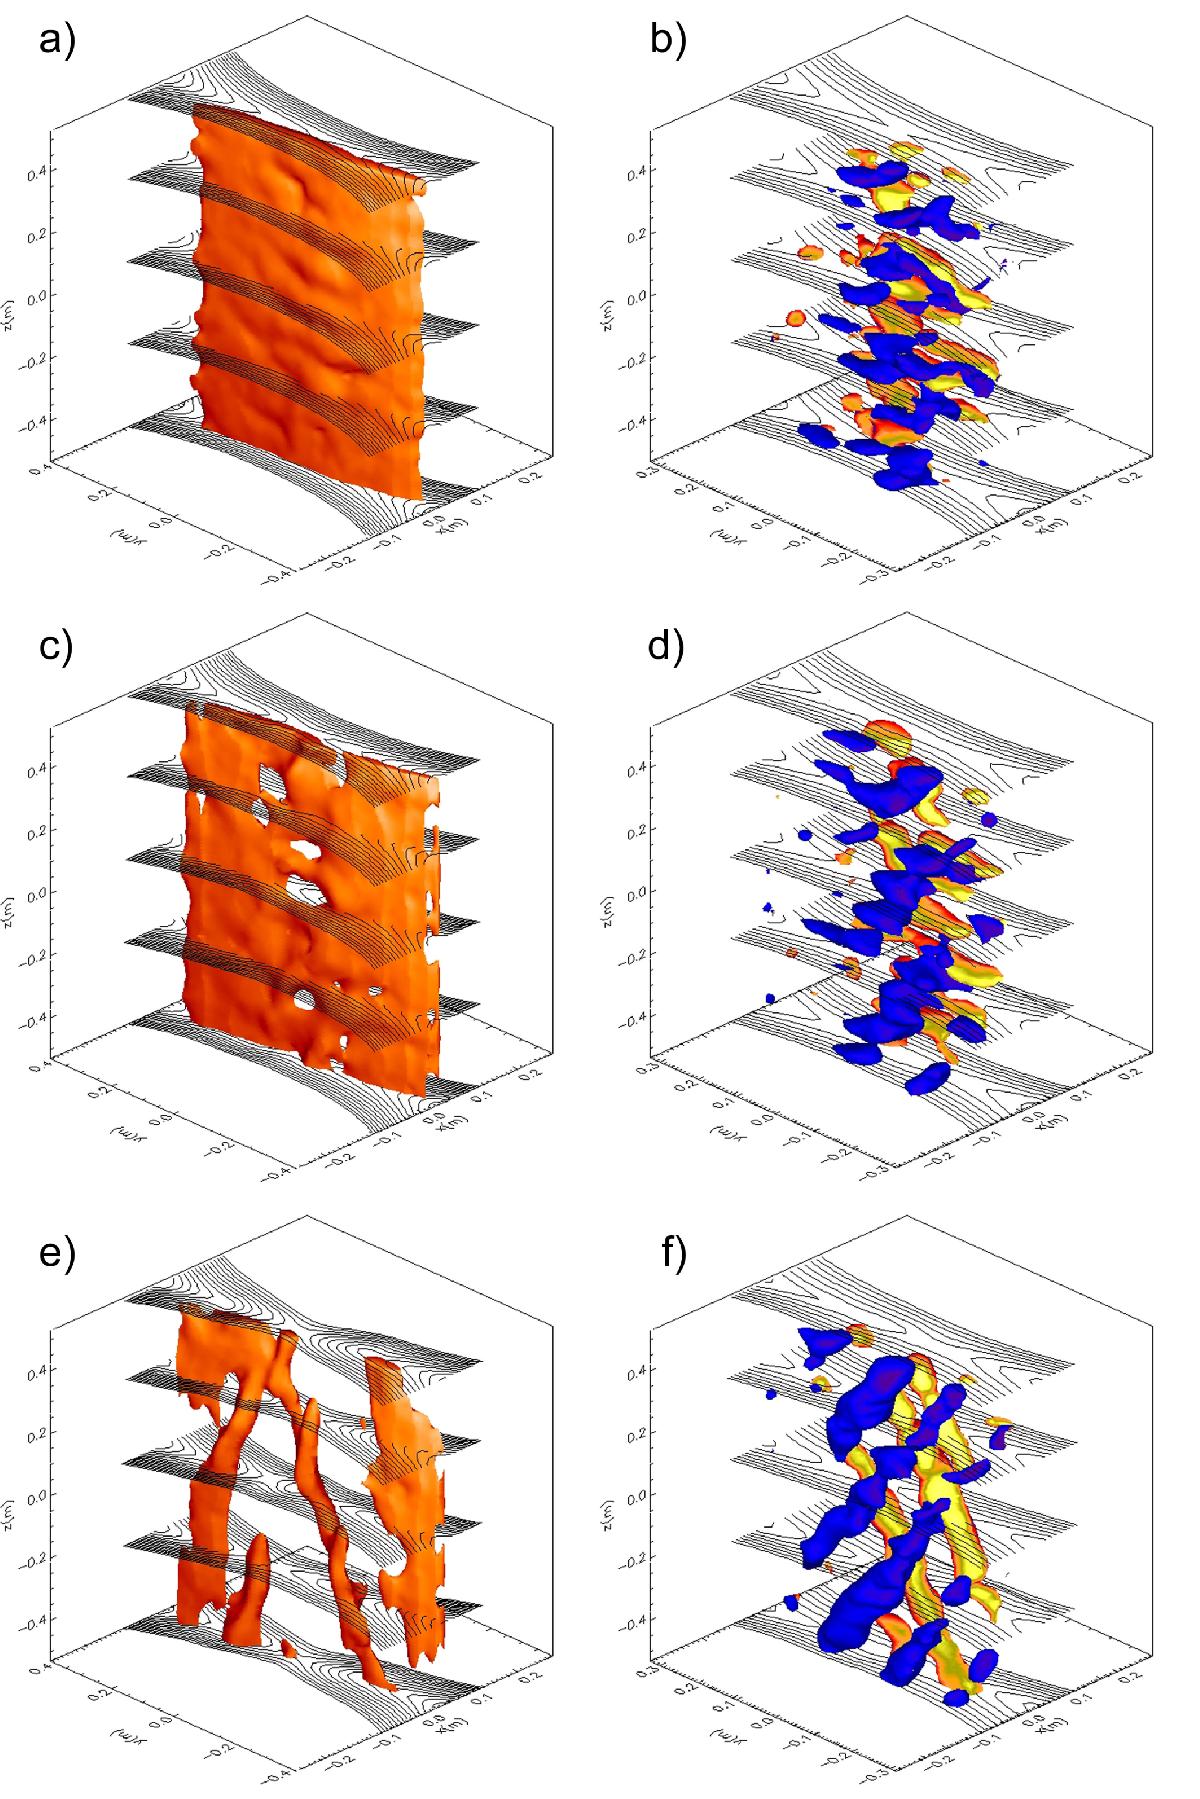
In the vertical direction, panels a), c), and e) show the time evolution of the 3D out-of-plane current density (jez) at t = 337ωpe,t = 362ωpe, and t = 387ωpe. Current density is represented as an isosurface of 2/3 the maximum current density at the respective time. Again, in the vertical direction, panels b), d), and f) show isosurfaces of the Q-value (see Eq. (5)) at the same times in the simulation. For clarity, isosurfaces left of the current sheet are shown in blue and isosurfaces right of the current sheet are in yellow. In all panels, in-plane magnetic field-lines are superimposed on flux-tubes, showing the magnetic field at several horizontal slices through the simulation box. The simulation times shown were chosen around the time of island/vortex formation, which occurred slightly earlier in the 3D case.
Current usage metrics show cumulative count of Article Views (full-text article views including HTML views, PDF and ePub downloads, according to the available data) and Abstracts Views on Vision4Press platform.
Data correspond to usage on the plateform after 2015. The current usage metrics is available 48-96 hours after online publication and is updated daily on week days.
Initial download of the metrics may take a while.