Fig. 4
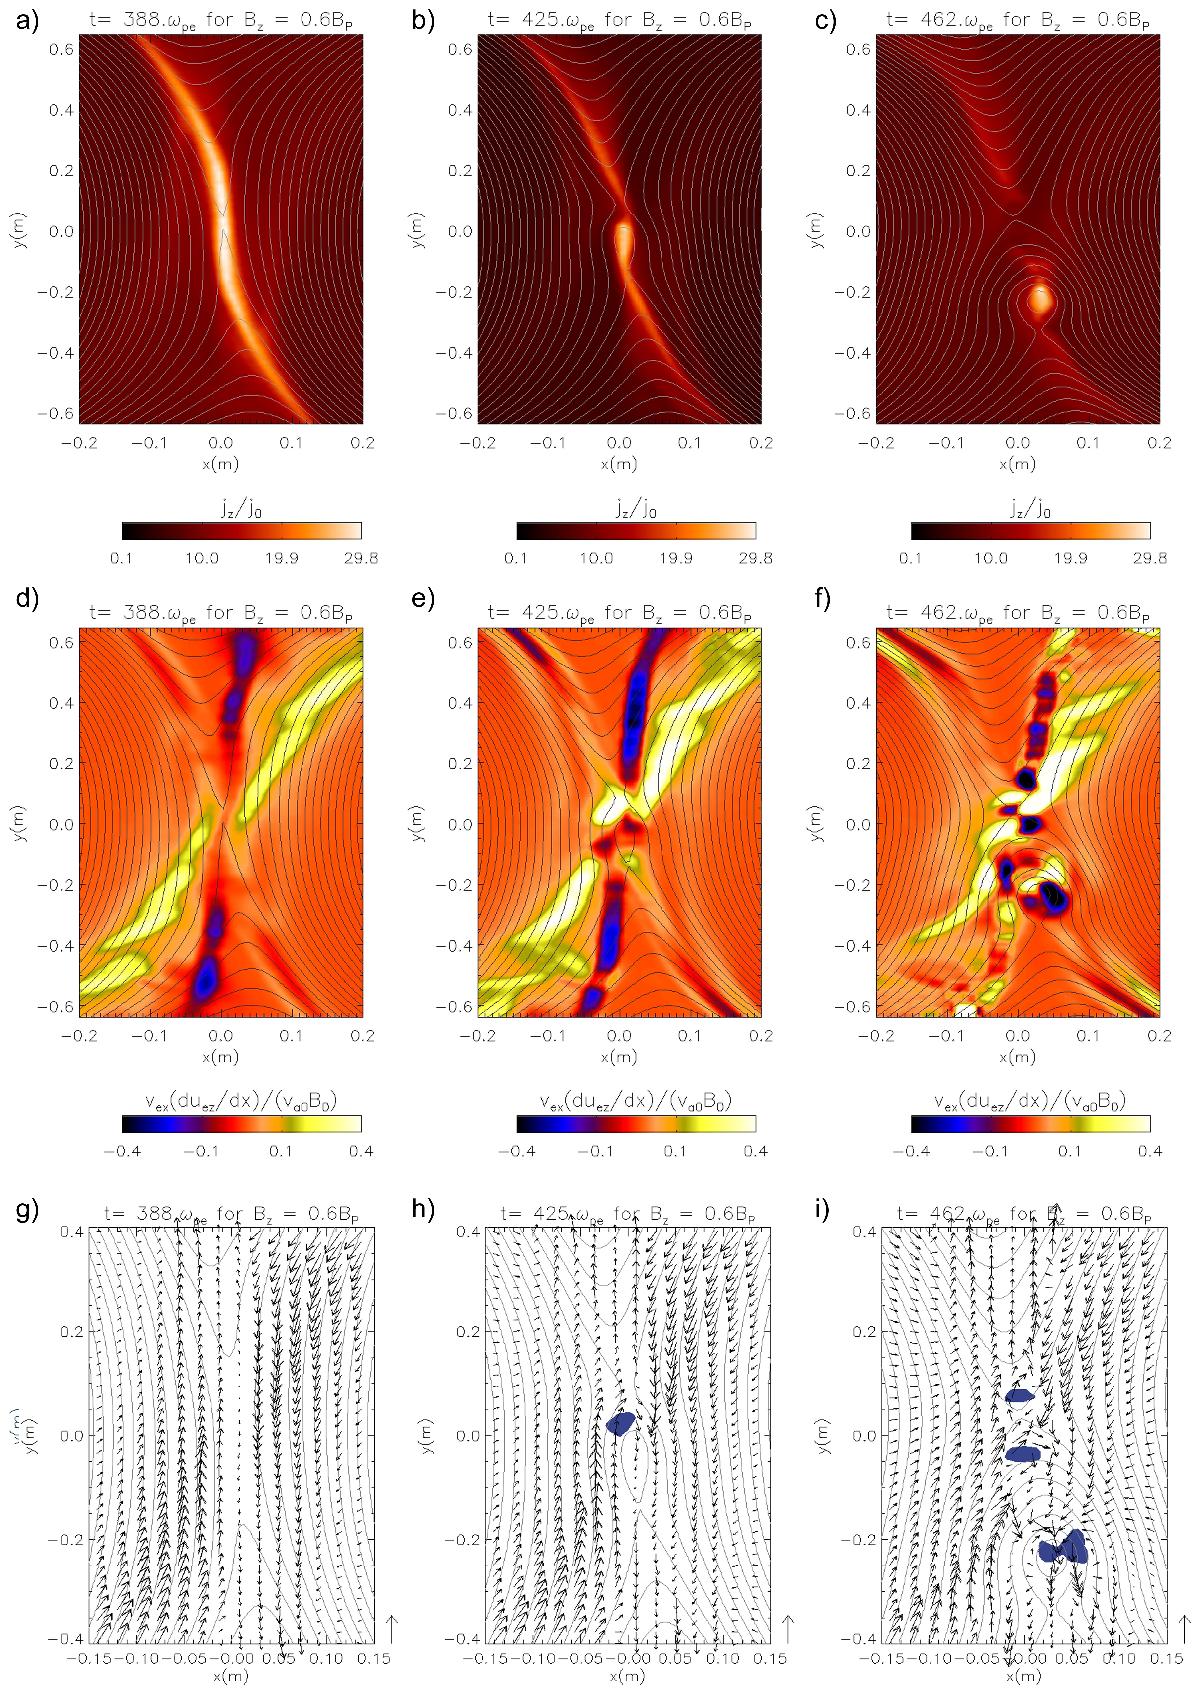
From top to bottom: time progressions of the current density; the dominant component of the convective inertia, ![]() ; and the Q-value. Superimposed on all plots is the in-plane magnetic field, and panels g), h), and i) also show electron velocities as well as coloured areas where the Q-value is greater than zero, indicating the existence of a vortex. The lengths of the arrows next to the plots represent the greatest speeds reached, in each panel approximately 0.22c, i.e. 2.2vae0. The simulation times, indicated at the top of each panel, were chosen around the occurrence of island and vortex formation.
; and the Q-value. Superimposed on all plots is the in-plane magnetic field, and panels g), h), and i) also show electron velocities as well as coloured areas where the Q-value is greater than zero, indicating the existence of a vortex. The lengths of the arrows next to the plots represent the greatest speeds reached, in each panel approximately 0.22c, i.e. 2.2vae0. The simulation times, indicated at the top of each panel, were chosen around the occurrence of island and vortex formation.
Current usage metrics show cumulative count of Article Views (full-text article views including HTML views, PDF and ePub downloads, according to the available data) and Abstracts Views on Vision4Press platform.
Data correspond to usage on the plateform after 2015. The current usage metrics is available 48-96 hours after online publication and is updated daily on week days.
Initial download of the metrics may take a while.