Fig. 5
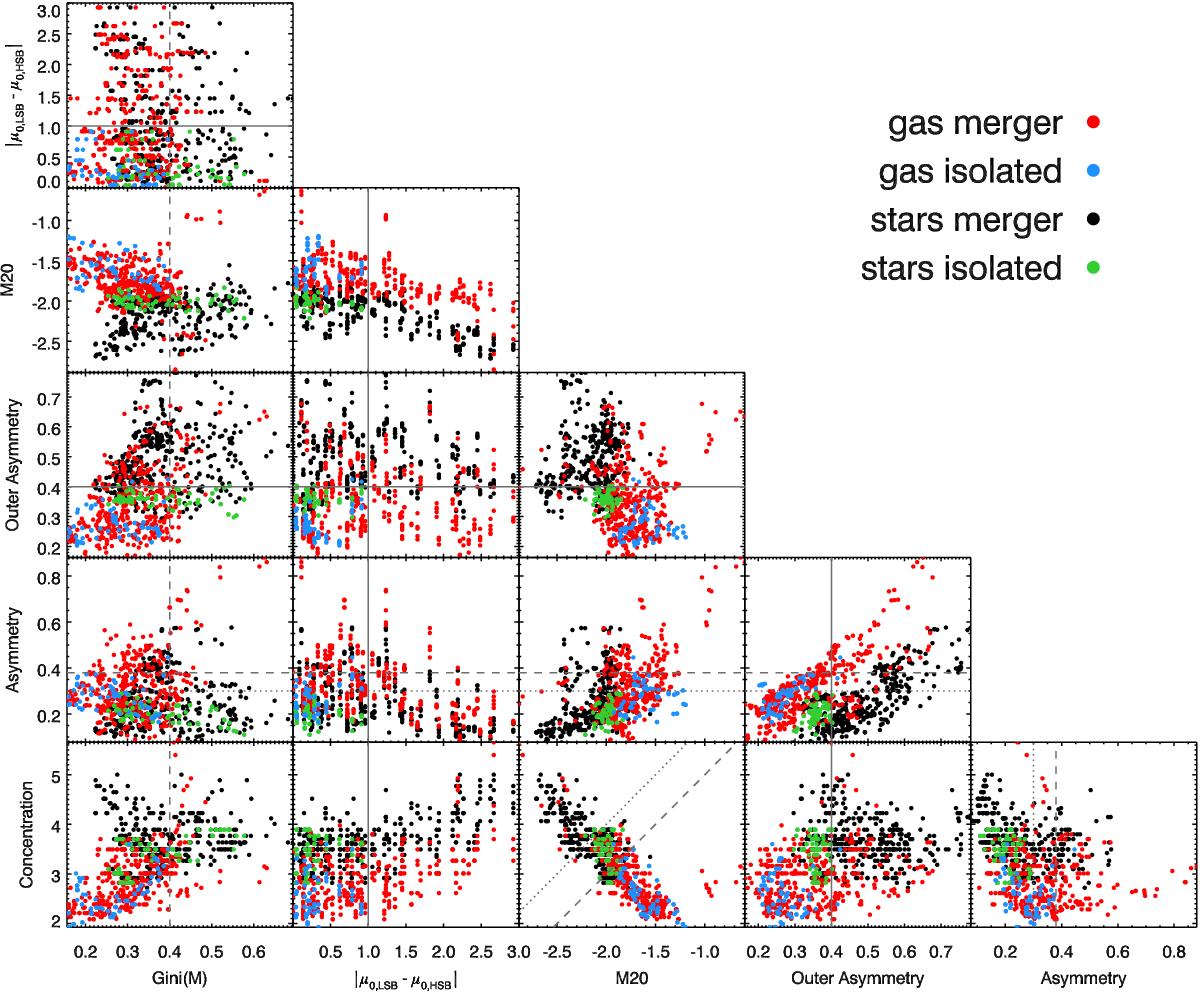
Concentration C, asymmetry A, outer asymmetry OA, M20, Gini(M), and excess central surface brightness | μ0,HSB−μ0,LSB |, for the gas in merger simulations (red) and in isolation (blue), and for the stars in merger simulations (black) and in isolation (green). The simulations shown correspond to the model-A dwarf, and encompass 14 different runs with varying satellite masses, halo concentrations, orbits, and radial extend of the gas disks with respect of the stellar disks (with Rg = Rd, 2Rd, or 4Rd) as described in Sect. 2. For more details on the simulations, see Starkenburg et al. (2016). The dotted, dashed and solid lines indicate regions where the isolated and merger systems are well separated for the stars, for the gas or for both, respectively.
Current usage metrics show cumulative count of Article Views (full-text article views including HTML views, PDF and ePub downloads, according to the available data) and Abstracts Views on Vision4Press platform.
Data correspond to usage on the plateform after 2015. The current usage metrics is available 48-96 hours after online publication and is updated daily on week days.
Initial download of the metrics may take a while.