Fig. 1
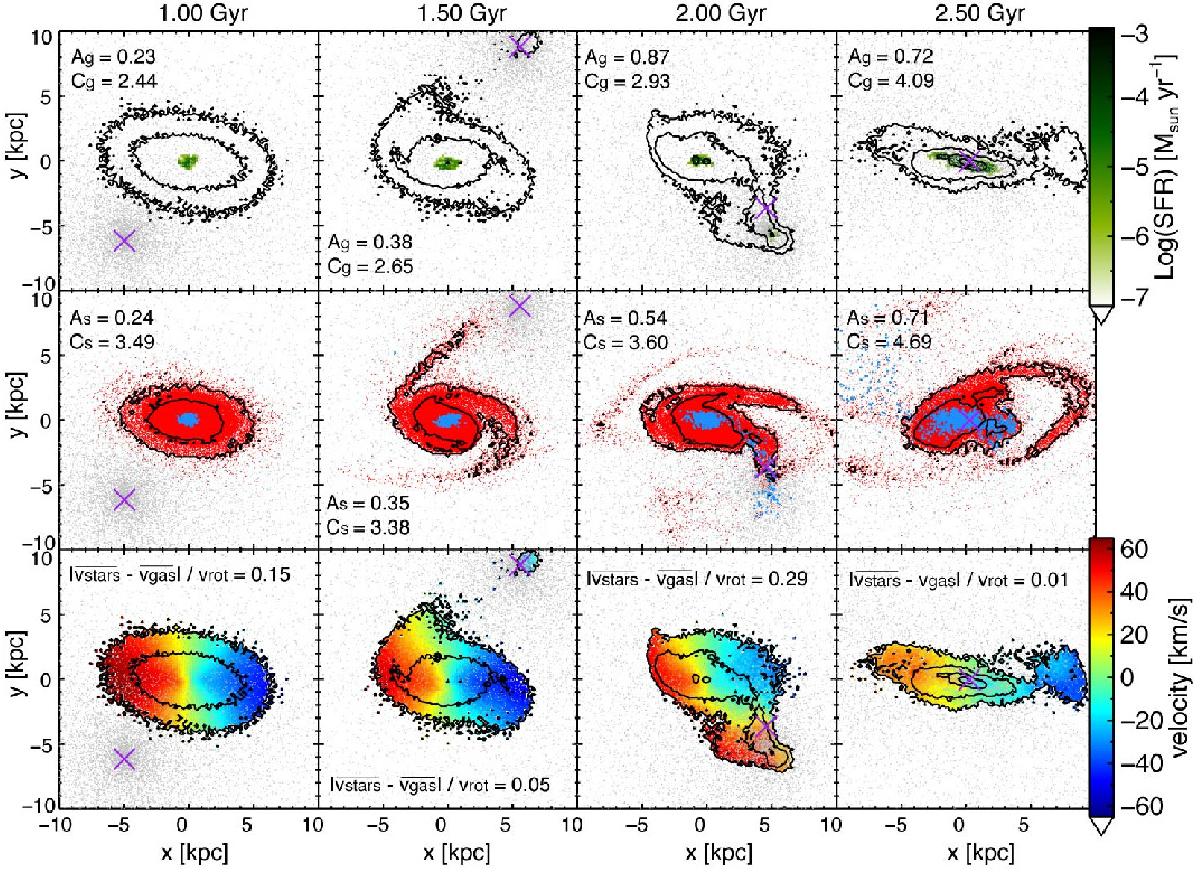
Evolution of the model-A dwarf galaxy with Rg = 4Rd, merging with a 20% mass ratio dark satellite with c = 25 on a co-planar relatively radial orbit (the intermediate orbit in Table 2). All figures show an inclined view of the disk, 60 deg from face-on. The top row shows the gas in the disk above a certain column density (contours at 0.4, 1, 4, and 10 × 1020 N cm-2) with the star-forming gas highlighted in green (see colourbar for SFR values). The central row panels show the old stars in red, and those newly formed in blue, along with two surface brightness contours of 25 mag/arcsec2 and 28 mag/arcsec2, obtained assuming an M/L = 0.5 for all stellar particles. The bottom panels show the gas contours with the gas velocity maps. In all panels the satellite is shown in grey (5% of the particles are plotted), with the purple cross denoting its centre of mass. The insets indicate the values of asymmetry, concentration and difference in average velocity between stars and gas computed as described in Sect. 4.
Current usage metrics show cumulative count of Article Views (full-text article views including HTML views, PDF and ePub downloads, according to the available data) and Abstracts Views on Vision4Press platform.
Data correspond to usage on the plateform after 2015. The current usage metrics is available 48-96 hours after online publication and is updated daily on week days.
Initial download of the metrics may take a while.