Fig. 8
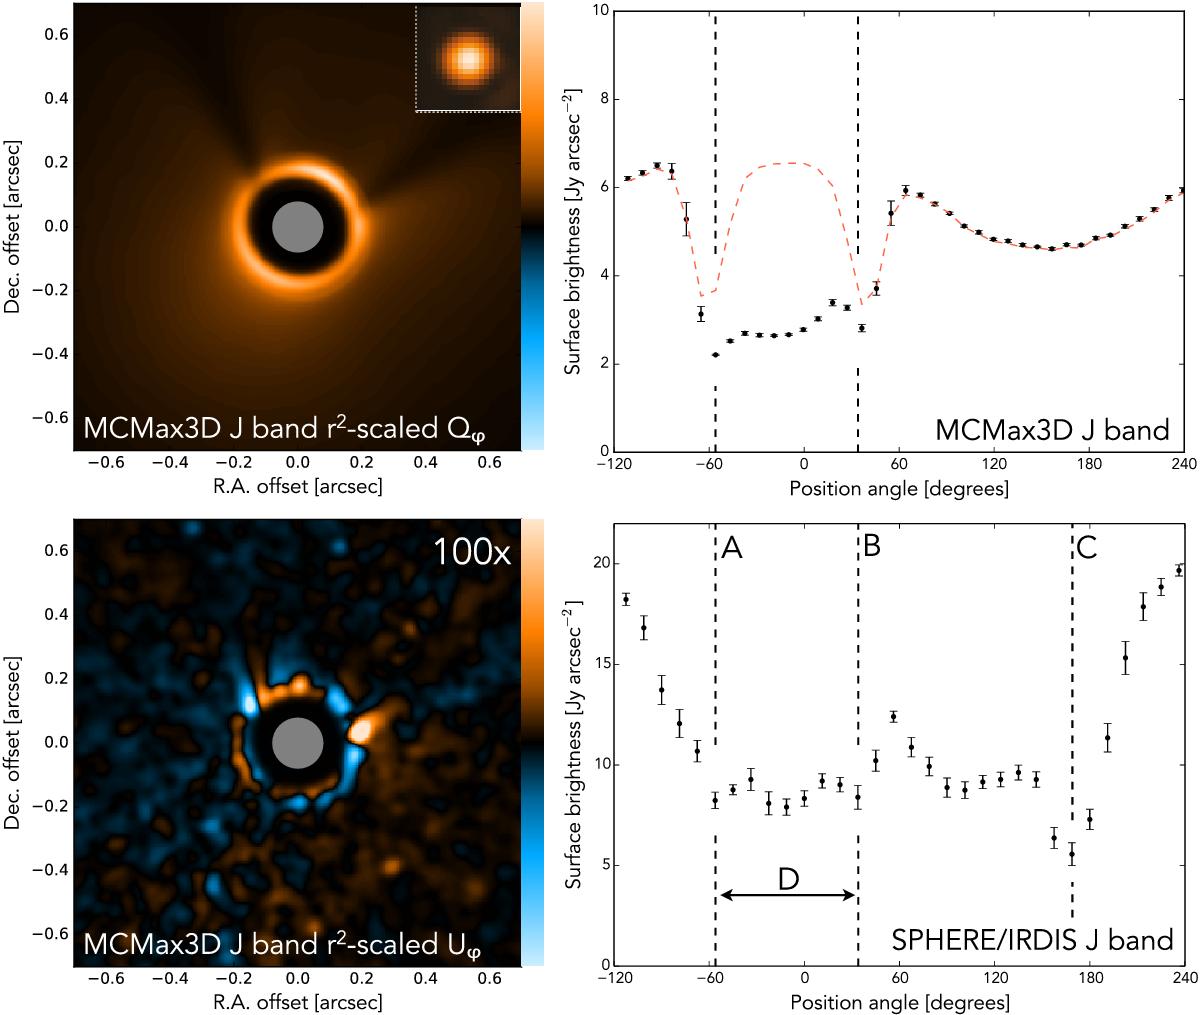
Synthetic Qφ (top left) and Uφ (bottom left) polarized intensity images and the radially collapsed surface brightness from the radiative transfer model (top right) and the IRDIS J-band image (bottom right). The inset of the synthetic Qφ image shows the PSF core of the J-band observation. The MCMax3D radiative transfer model has been constructed to qualitatively reproduce shadow features A, B, and D. Both images have been scaled with the squared distance from each pixel to the star and are shown on a linear color stretch with the Uφ color stretch 100 times harder than the Qφ stretch. The 80 mas inner working angle of the coronagraph of the J-band observation has been masked out. The red dashed line in the top right figure shows the same radiative transfer model but without the warped disk region (zone 2). The vertically dashed lines show the locations of the surface brightness minima of shadow features A, B, and C. The error bars of the integrated surface brightness show 1σ of the corresponding position angle bin in the Uφ image.
Current usage metrics show cumulative count of Article Views (full-text article views including HTML views, PDF and ePub downloads, according to the available data) and Abstracts Views on Vision4Press platform.
Data correspond to usage on the plateform after 2015. The current usage metrics is available 48-96 hours after online publication and is updated daily on week days.
Initial download of the metrics may take a while.