Fig. 7
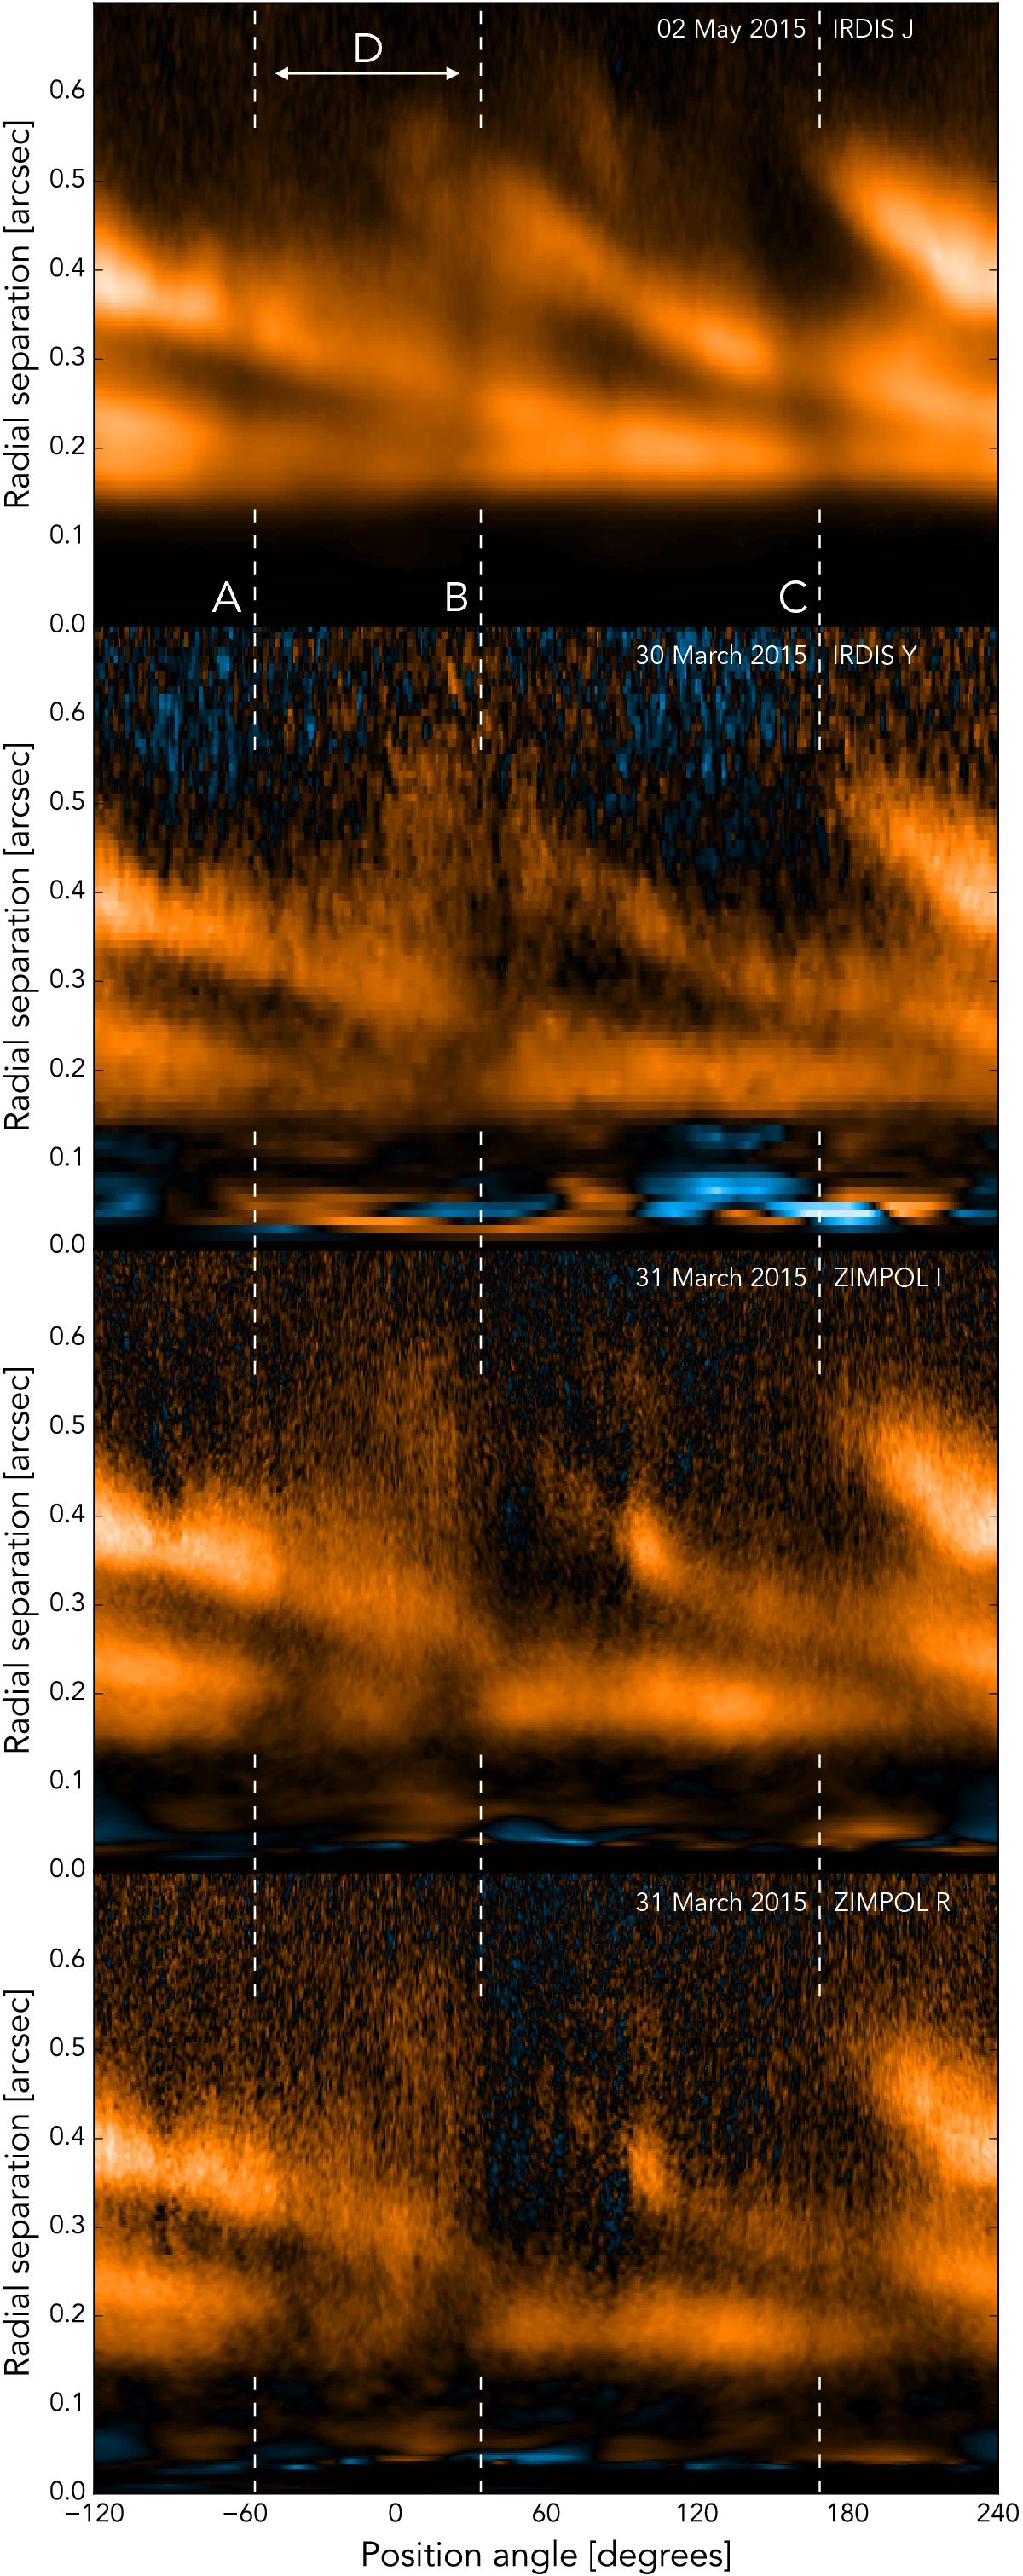
Polar projections of the r2-scaled Qφ images for J, Y, I, and R-band (top to bottom). The vertically dashed lines correspond to shadow lanes A, B, and C and are identical to the dashed lines in Fig. 8. The identified shadow features have been labeled in the J-band image. North corresponds to PA = 0° and positive position angles are measured east from north.
Current usage metrics show cumulative count of Article Views (full-text article views including HTML views, PDF and ePub downloads, according to the available data) and Abstracts Views on Vision4Press platform.
Data correspond to usage on the plateform after 2015. The current usage metrics is available 48-96 hours after online publication and is updated daily on week days.
Initial download of the metrics may take a while.