Fig. 6
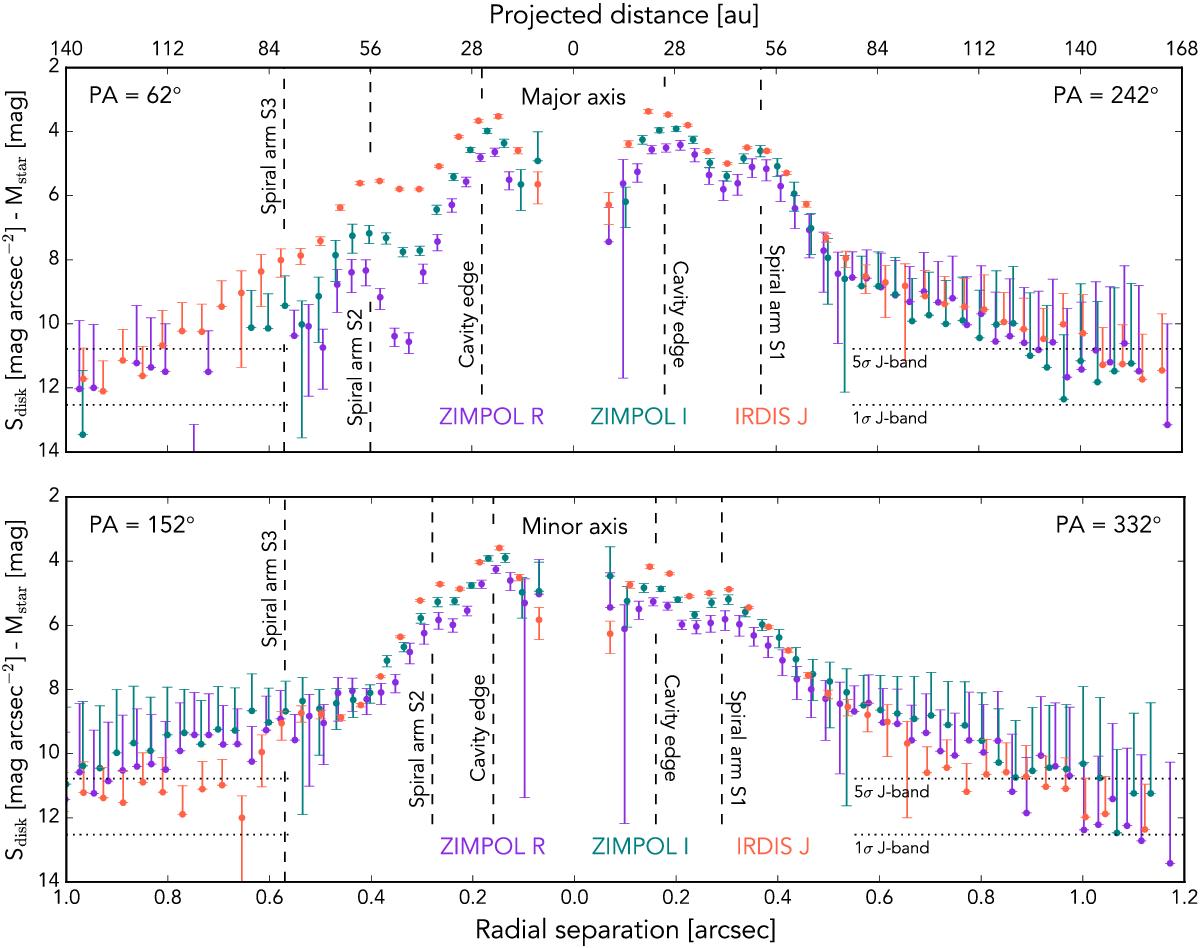
Polarized surface brightness profiles along the major axis (top) and minor axis (bottom) of the HD 135344B disk. The position angle of the axis (measured east of north) is shown in the top left and right, and the colors indicate different filters. Data points show the mean Qφ surface brightness and the error bars show 1σ uncertainties determined from the corresponding Uφ image. We have rejected bins in which the mean Qφ count rate is negative as well as lower limit error bars that correspond to negative flux values. We note that the error bars do not include the uncertainty from the photometric calibration. The dotted lines show 1σ and 5σ background levels in the QφJ-band image at large separation from the star.
Current usage metrics show cumulative count of Article Views (full-text article views including HTML views, PDF and ePub downloads, according to the available data) and Abstracts Views on Vision4Press platform.
Data correspond to usage on the plateform after 2015. The current usage metrics is available 48-96 hours after online publication and is updated daily on week days.
Initial download of the metrics may take a while.