Fig. 5
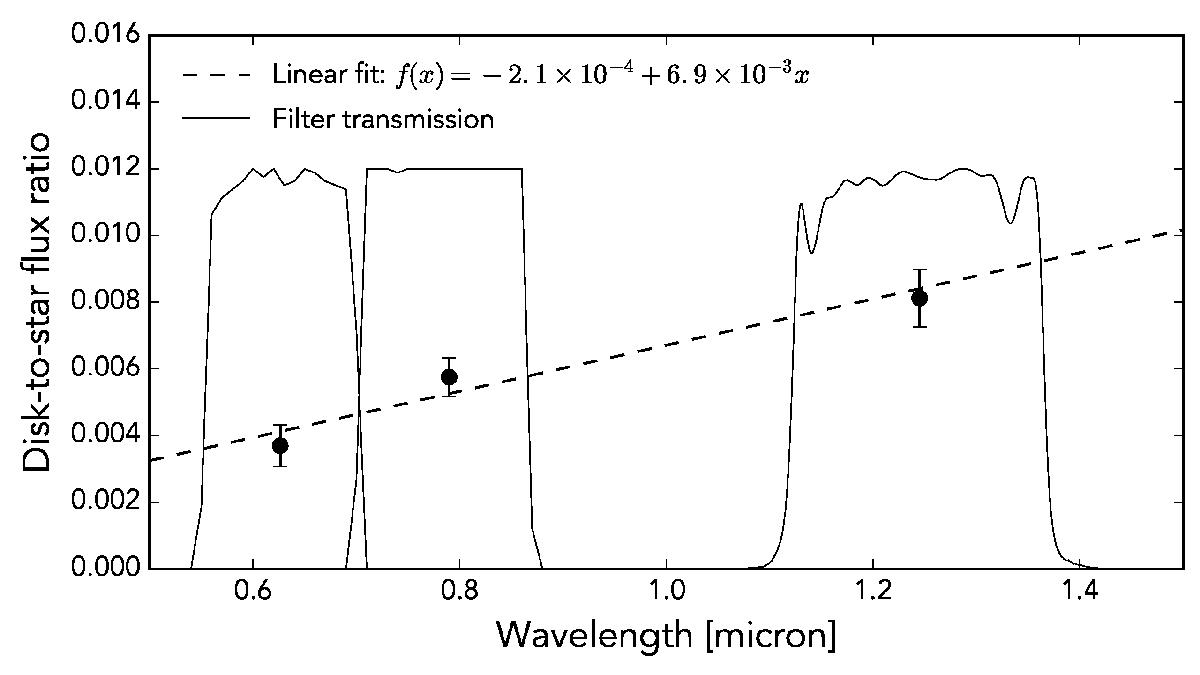
Disk-to-star flux ratio as determined from the Qφ image, which only includes polarized scattered light from the disk, and an unsaturated total intensity image, which is dominated by the stellar halo. The three data points are the flux ratios in R, I, and J-band with 3σ error bars. The dashed line shows a weighted least squares fit of a linear function and the solid lines are the normalized transmission curves of the three filters.
Current usage metrics show cumulative count of Article Views (full-text article views including HTML views, PDF and ePub downloads, according to the available data) and Abstracts Views on Vision4Press platform.
Data correspond to usage on the plateform after 2015. The current usage metrics is available 48-96 hours after online publication and is updated daily on week days.
Initial download of the metrics may take a while.