Fig. B.1
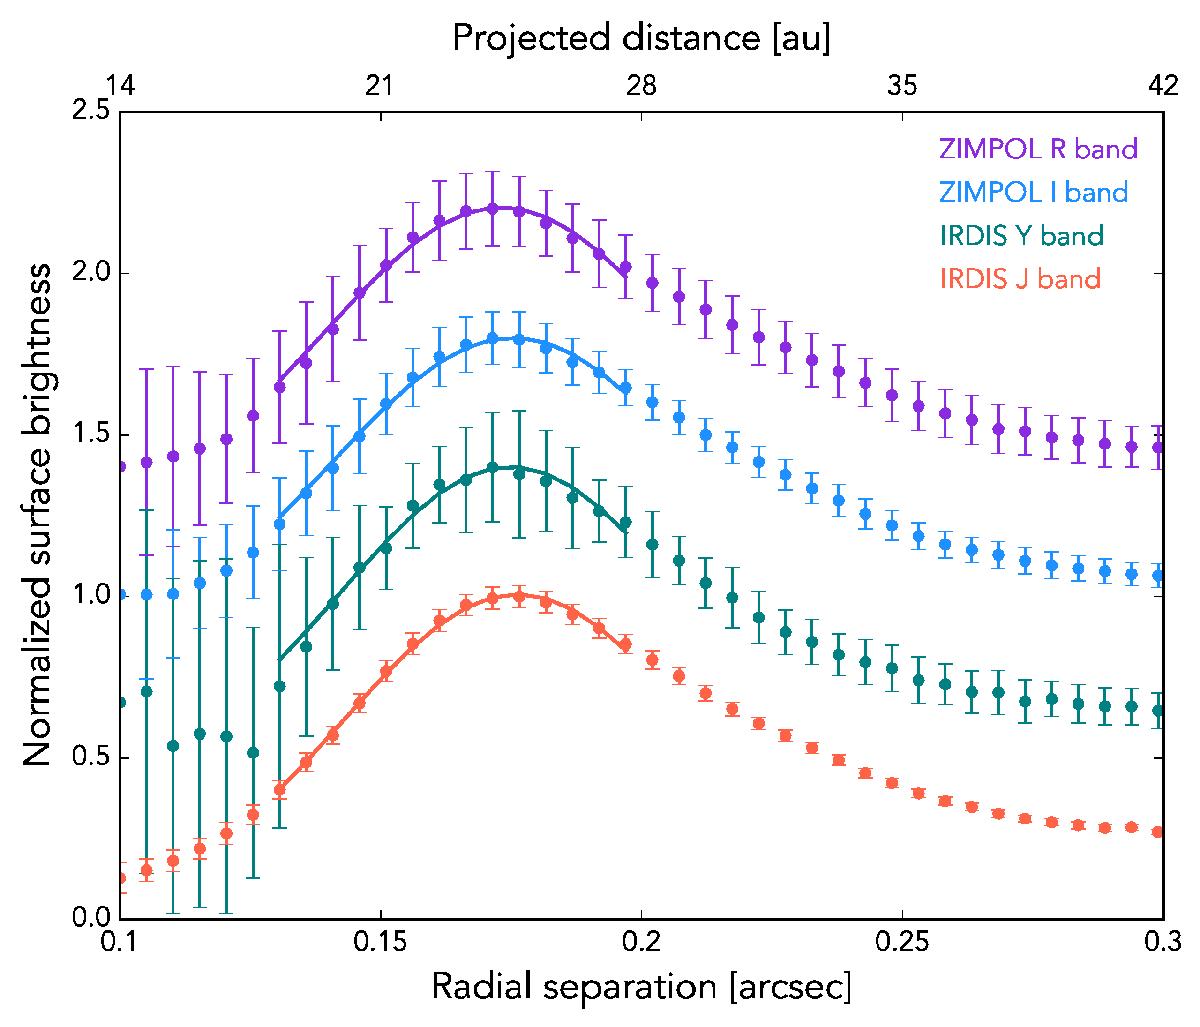
Azimuthally averaged polarized surface brightness around the cavity edge of the outer disk. The profiles are shown in normalized units and with arbitrary offsets. The data points show the mean Qφ value in each bin and the error bars show 1σ deviations in the corresponding Uφ bin. Solid lines show the best-fit Gaussian profiles (see also Table B.1).
Current usage metrics show cumulative count of Article Views (full-text article views including HTML views, PDF and ePub downloads, according to the available data) and Abstracts Views on Vision4Press platform.
Data correspond to usage on the plateform after 2015. The current usage metrics is available 48-96 hours after online publication and is updated daily on week days.
Initial download of the metrics may take a while.