Fig. 11
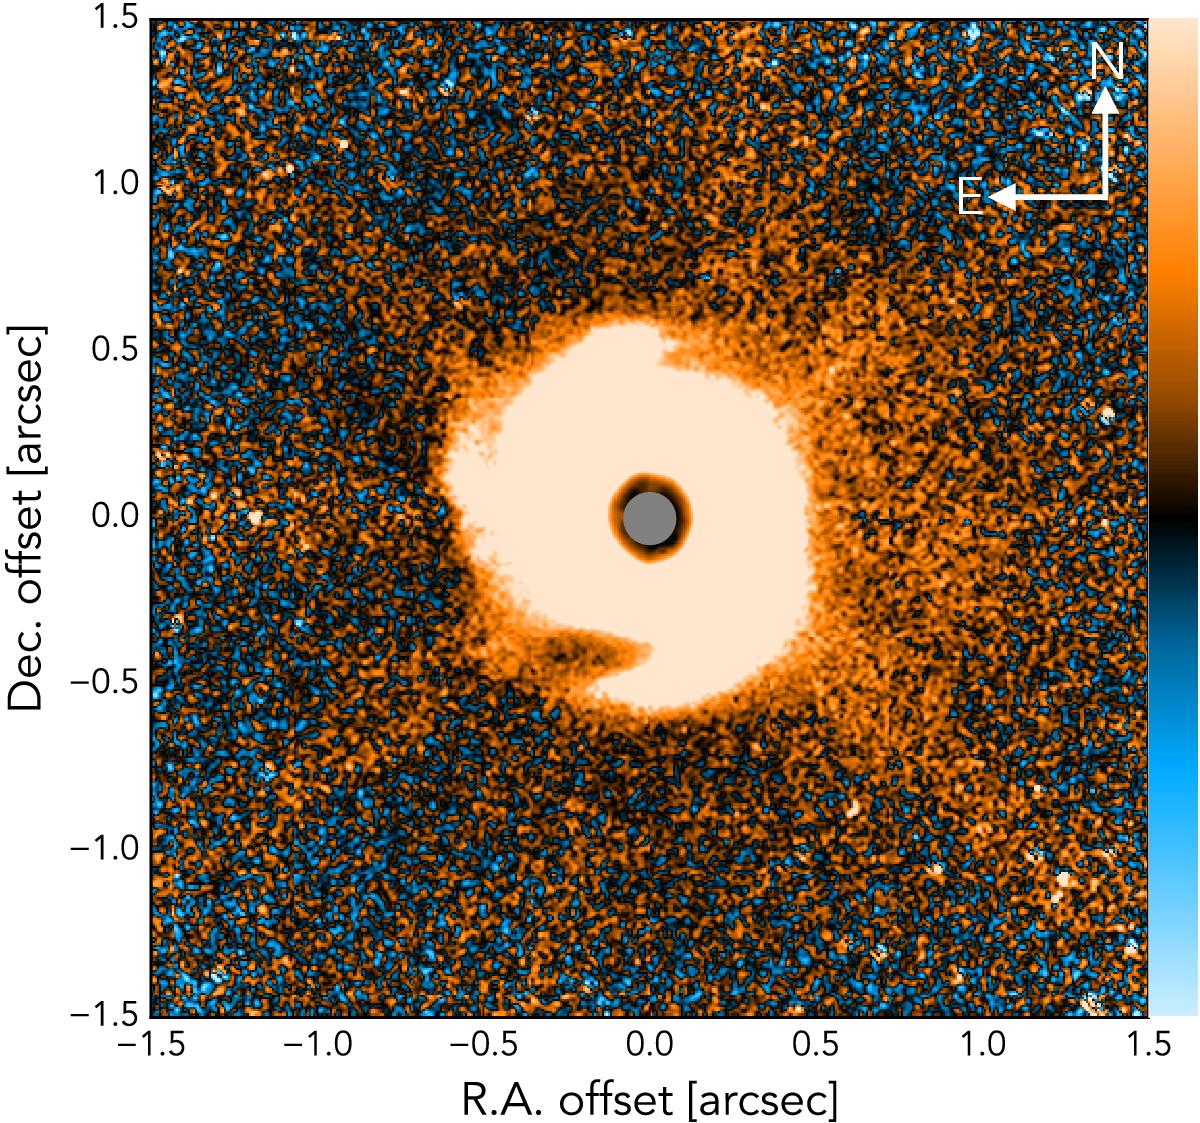
IRDIS J-band r2-scaled Qφ image shown with a ten times harder linear color stretch compared to the image in Fig. 2. Orange corresponds to positive pixel values, blue to negative pixel values, and black is the zero point. The 80 mas inner working angle of the coronagraph has been masked out. Features from the telescope spiders are clearly visible.
Current usage metrics show cumulative count of Article Views (full-text article views including HTML views, PDF and ePub downloads, according to the available data) and Abstracts Views on Vision4Press platform.
Data correspond to usage on the plateform after 2015. The current usage metrics is available 48-96 hours after online publication and is updated daily on week days.
Initial download of the metrics may take a while.