Fig. 1
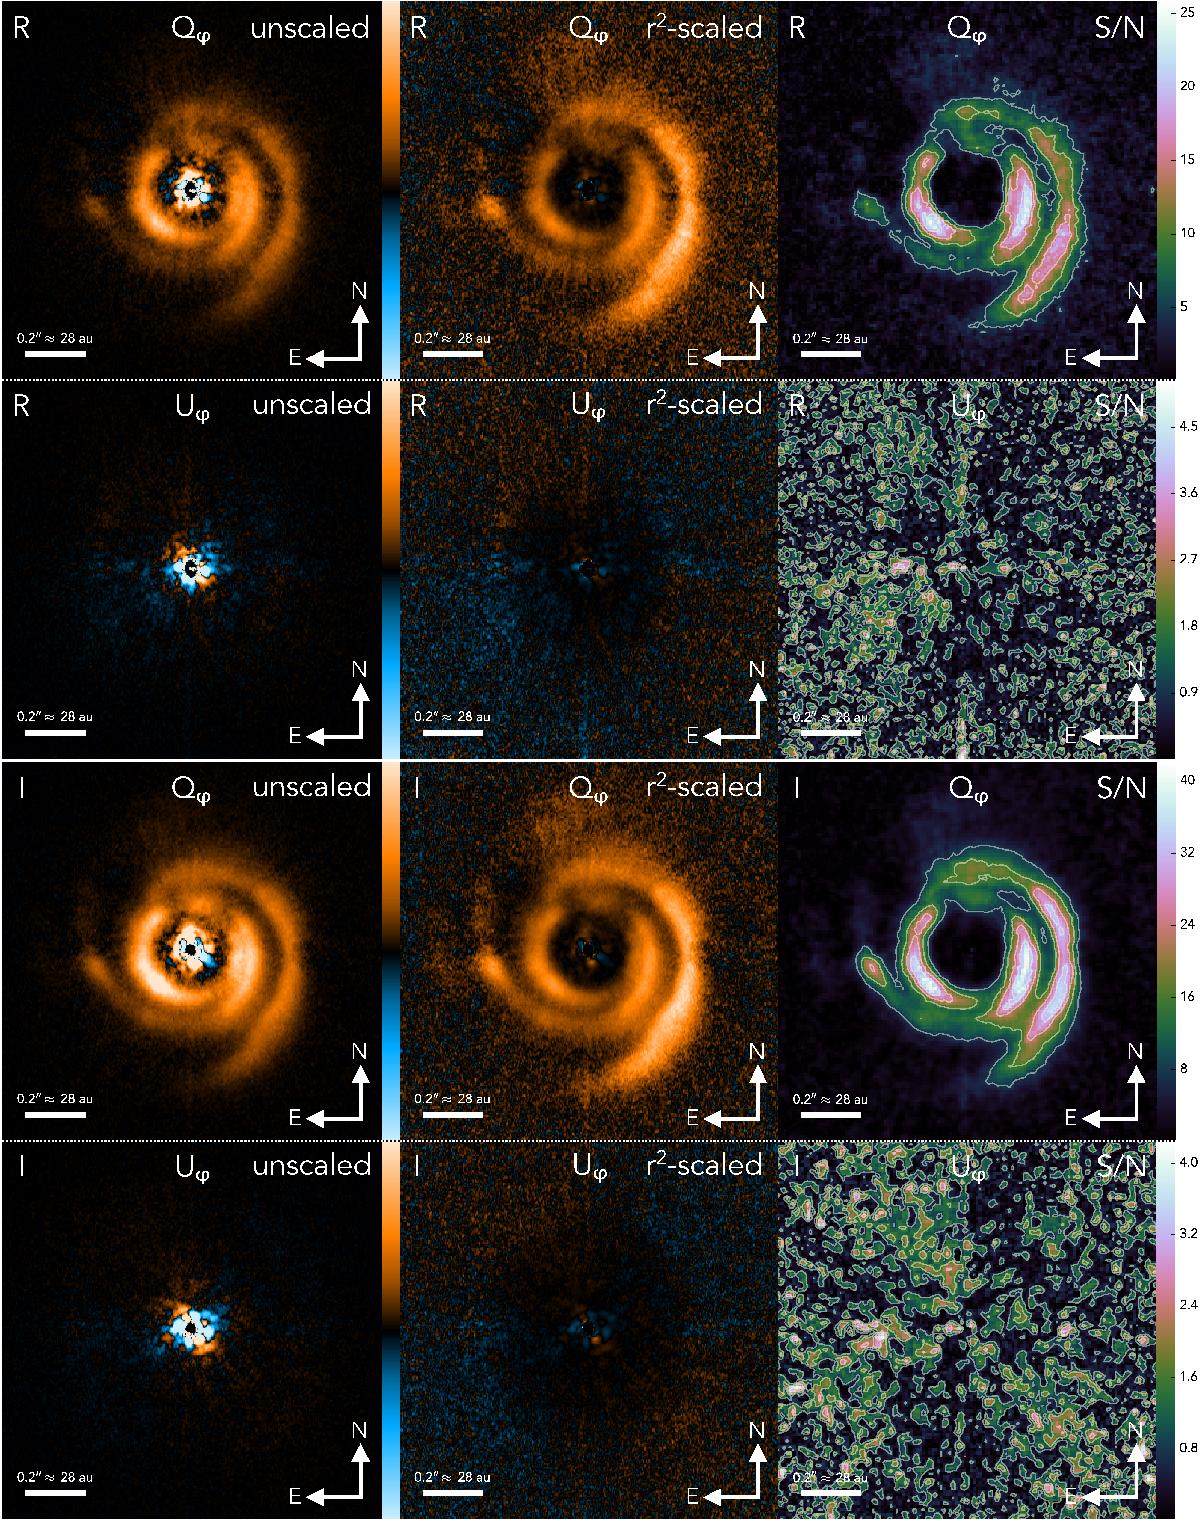
ZIMPOL R-band (top two rows) and ZIMPOL I-band (bottom two rows) polarized intensity images. The field of view is 1.′′4 × 1.′′4 and the central star is positioned in the center of each image. The left column shows the Qφ and Uφ polarized intensity images (see Sect. 2.3). The center column shows the Qφ and Uφ images scaled with the deprojected distance squared from the star to each pixel for an inclination of 11° and a position angle of the major axis of 62°. All images are shown on a linear color stretch, with companion Qφ and Uφ images having the same minimum and maximum value. Orange corresponds to positive values, blue to negative values, and black is the zero point. The right column shows the signal-to-noise (S/N) maps of the Qφ and Uφ images which are obtained from the Uφ images. The contour levels correspond to the standard deviation values that are shown on the right of the S/N map colorbar.
Current usage metrics show cumulative count of Article Views (full-text article views including HTML views, PDF and ePub downloads, according to the available data) and Abstracts Views on Vision4Press platform.
Data correspond to usage on the plateform after 2015. The current usage metrics is available 48-96 hours after online publication and is updated daily on week days.
Initial download of the metrics may take a while.