Fig. 5
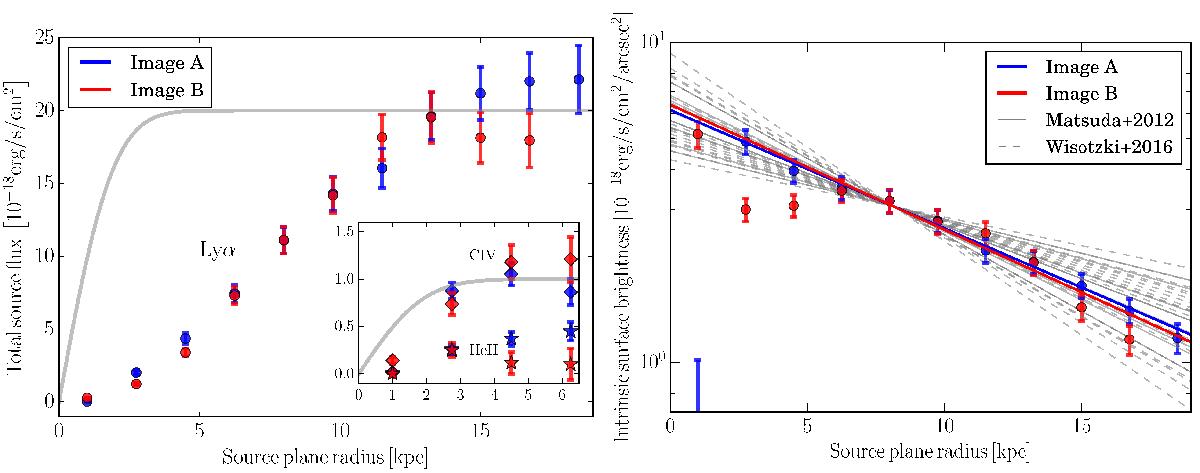
Left panel: total flux on the source plane of the two multiple images of the LAB within the MUSE footprint, i.e. A1 and B1. The circles are the Lyα emission. In the inset plot we show the C iv and He ii emissions, diamonds and stars respectively (the units are the same as in the main plot). The grey lines show the theoretical shape on the source plane of a Gaussian emission with observed scale of ![]() and arbitrary total flux. Right panel: intrinsic Lyα surface brightness. The red and blue lines indicate the best fit of an exponential function (considering the points r> 5 kpc, see text for details). The grey solid and dashed lines are the results from Matsuda et al. (2012) and Wisotzki et al. (2016), respectively, renormalized to r = 8 kpc.
and arbitrary total flux. Right panel: intrinsic Lyα surface brightness. The red and blue lines indicate the best fit of an exponential function (considering the points r> 5 kpc, see text for details). The grey solid and dashed lines are the results from Matsuda et al. (2012) and Wisotzki et al. (2016), respectively, renormalized to r = 8 kpc.
Current usage metrics show cumulative count of Article Views (full-text article views including HTML views, PDF and ePub downloads, according to the available data) and Abstracts Views on Vision4Press platform.
Data correspond to usage on the plateform after 2015. The current usage metrics is available 48-96 hours after online publication and is updated daily on week days.
Initial download of the metrics may take a while.