Free Access
Fig. 4
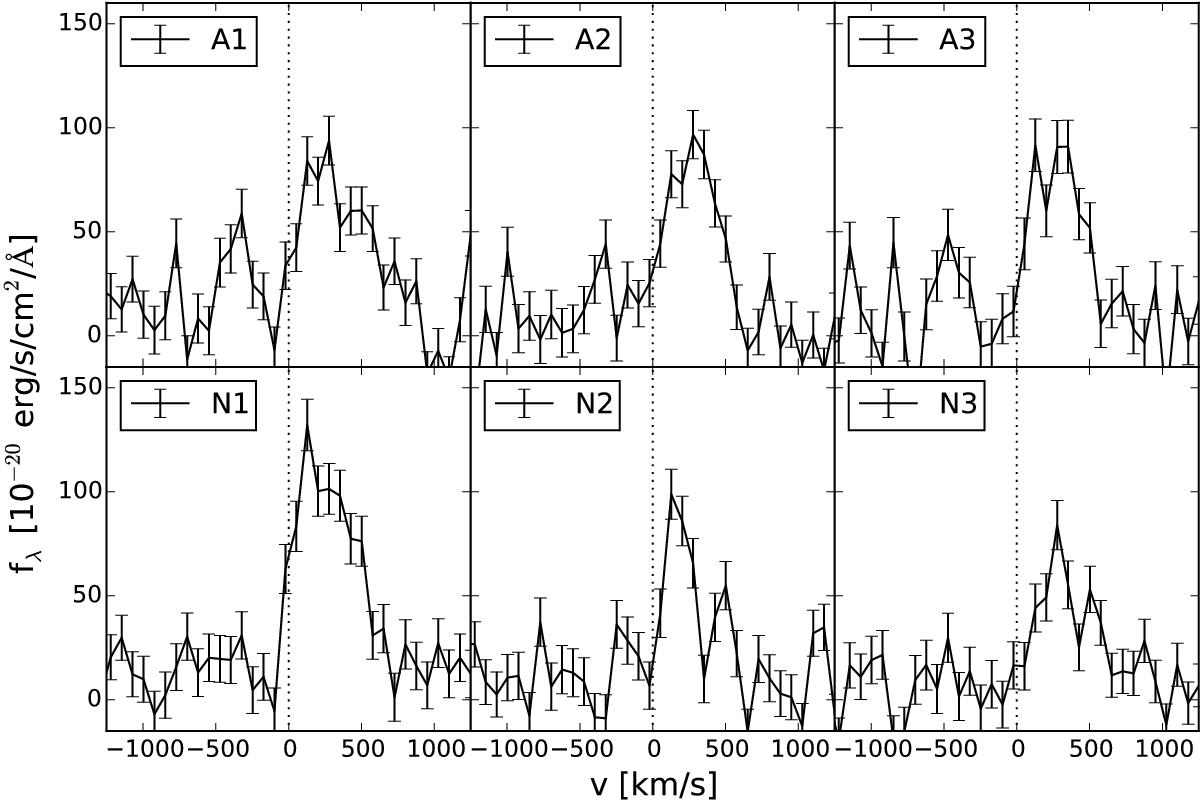
Lyα profile at different positions of the nebula. The top row shows the Lyα line at the HST counterparts A1, A2, and A3, while three positions throughout the nebula are shown by N1, N2, and N3. The spectra have been summed within a four pixel apperture radius and the coordinates are shown in Table 1.
Current usage metrics show cumulative count of Article Views (full-text article views including HTML views, PDF and ePub downloads, according to the available data) and Abstracts Views on Vision4Press platform.
Data correspond to usage on the plateform after 2015. The current usage metrics is available 48-96 hours after online publication and is updated daily on week days.
Initial download of the metrics may take a while.